Polkadot Price Analysis: Remains Pressured Below $7.80; Hold Or Exit?


The Polkadot price analysis shows a modest recovery. But, the downside risk remains intact below $8.0. The longer the time remained below the critical level, the more pressure would build up on the buyers. The formation of a bullish hammer on August 22 shows a tug-of-war between bulls and bears.
Right, now the price is trading in the green for the past few hours, indicating buyers are still in the game. As of publication time, DOT/USD is reading at $7.61, up 0.83% for the day. The 24-hour trading volume dropped nearly 5% to $290,548,901 according to CoinMarketCap data.
- Polkadot price analysis indicates a consolidation move on Thursday.
- An upward parallel channel suggests the continuation of an upside movement.
- A daily close above 23.6% Fibonacci retracement would confirm more gains.
Polkadot price stabilizes with positive bias
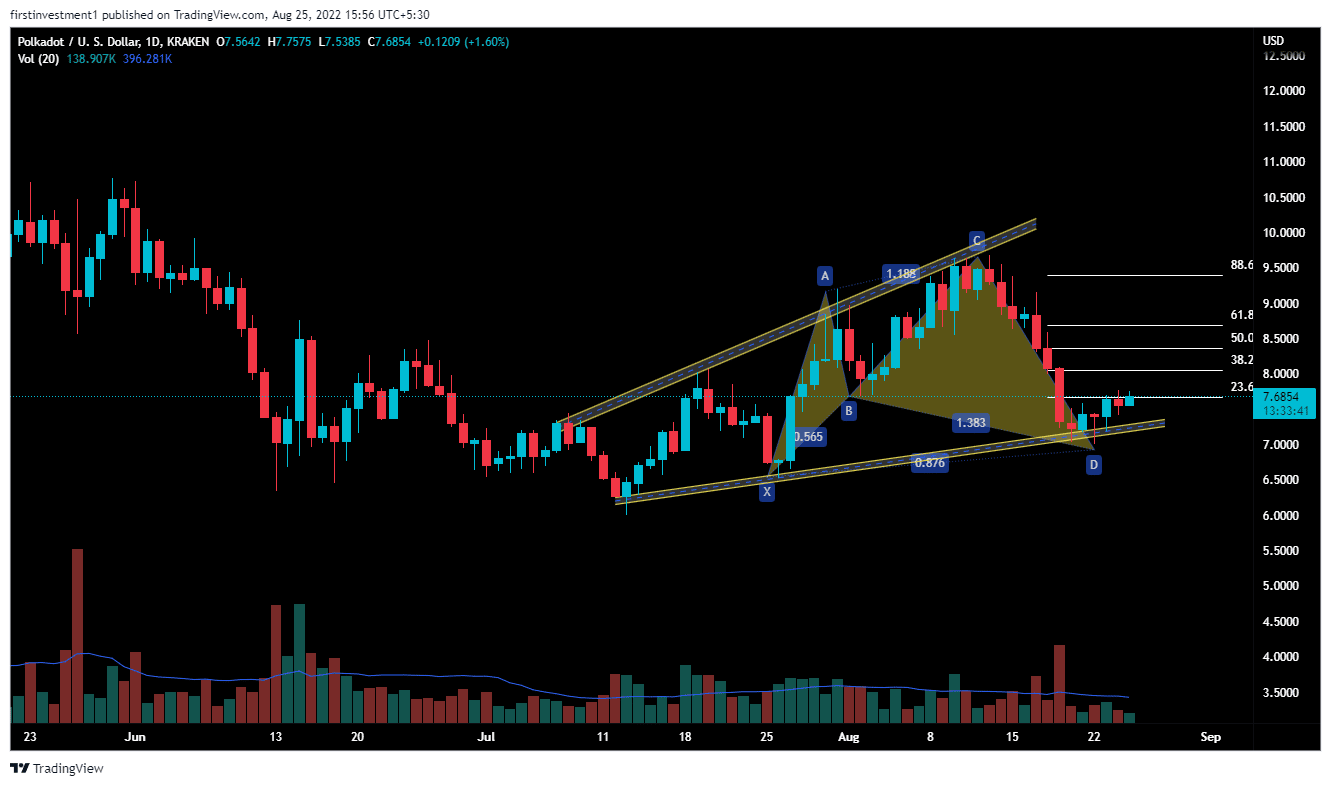
On the daily chart, DOT is trading in an ascending channel. As the recent price action indicates the movement in between two parallel upward-sloping lines. It is formed from two positive sloping trend lines drawn above and below a price series depicting resistance and support levels, respectively.
The price is making higher highs and higher lows. According to this pattern, if the price starts to move higher from its support level, with above the average volumes, then we can expect a good upside move. Otherwise, the price may not sustain higher for a long time.
Further, the Polkadot price analysis indicates the formation of a bullish “Bullish Shark” harmonic pattern. In a bullish shark pattern, however, the second top is higher than the first one. In addition, it combines Fibonacci with Elliott’s waves theory, and some new ratios like 88.6% are used. Along with this bullish pattern. The price hasn’t broken its previous swing low as well, indicating a possible reversal in the coming future.
According to this pattern, if the price closes above a strong bearish candle, testing the 88.6% Fib. level ($8.02), then we can expect a bullish movement of up to ($8.5).
On the flip side, a slippage below $7.45 would make bears hopeful.
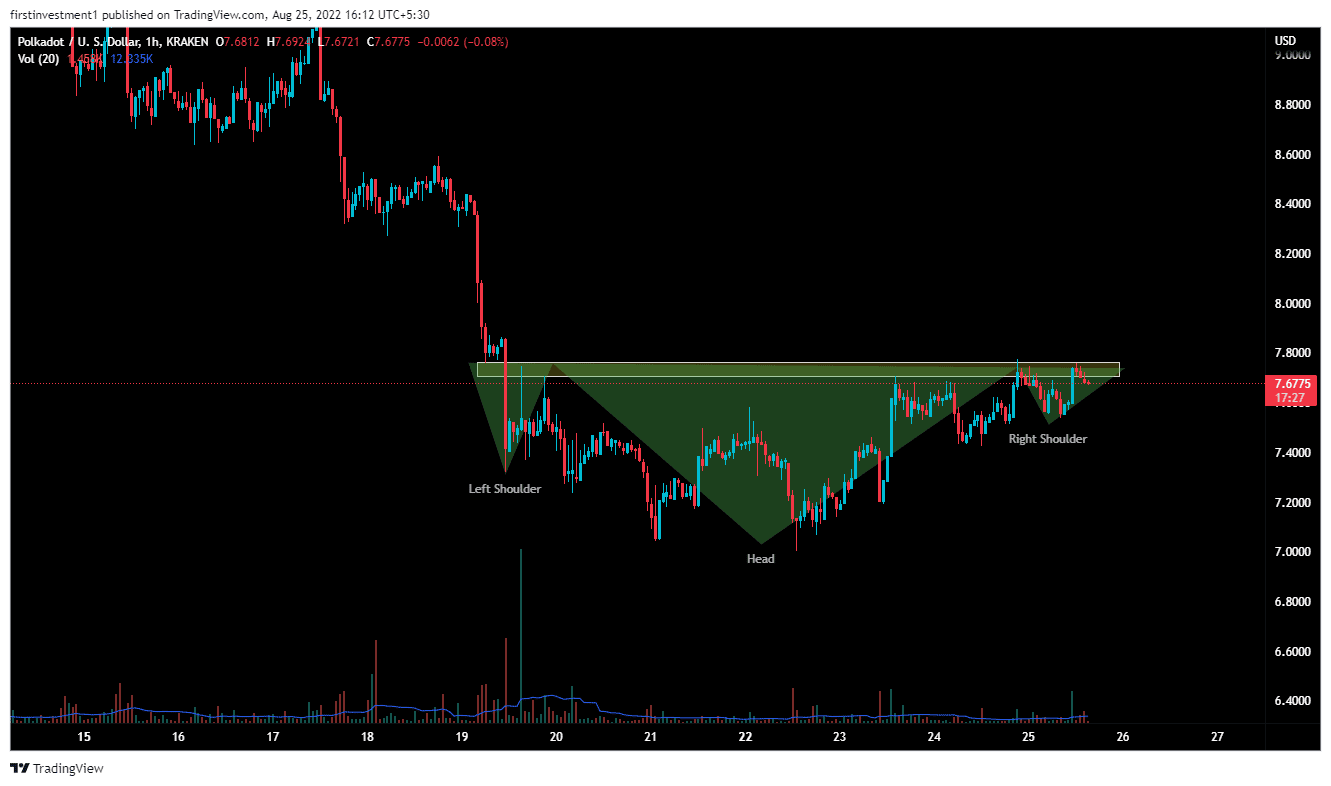
On the hourly chart, the price formed a bullish “Head & Shoulder” pattern. If the price gave a closing above $7.80 on the hourly chart, we can expect a bullish momentum up to $8.02.
On the other hand, closing below the $7.40 level could invalidate the bullish outlook. And the price can drop below $7.1.
DOT is modestly bullish on all time frames. If the price gave closing above $7.80 on the hourly chart, we can put our buy trade.

Why Trust CoinGape
CoinGape has covered the cryptocurrency industry since 2017, aiming to provide informative insights Read more…to our readers. Our journal analysts bring years of experience in market analysis and blockchain technology to ensure factual accuracy and balanced reporting. By following our Editorial Policy, our writers verify every source, fact-check each story, rely on reputable sources, and attribute quotes and media correctly. We also follow a rigorous Review Methodology when evaluating exchanges and tools. From emerging blockchain projects and coin launches to industry events and technical developments, we cover all facets of the digital asset space with unwavering commitment to timely, relevant information.
Related Articles


- Breaking: Bank of America (BofA) Reveals Holdings in This XRP ETF
- BlackRock Signal Further Downside for Bitcoin And Ethereum As It Moves $170M to Coinbase
- Just-In: Binance Buys Additional 1,315 BTC for SAFU Fund
- Big Short Michael Burry Issues Dire Warning on Bitcoin Price Crash Risks
- Kevin Warsh Nomination Hits Roadblock as Democrats Demand Answers on Powell, Cook
- Bitcoin Price Prediction As US House Passes Government Funding Bill to End Shutdown
- Ondo Price Prediction as MetaMask Integrates 200+ Tokenized U.S. Stocks
- XRP Price Risks Slide to $1 Amid Slumping XRPL Metrics and Burn Rate
- Gold and Silver Prices Turn Parabolic in One Day: Will Bitcoin Mirror the Move?
- Cardano Price Prediction as the Planned CME’s ADA Futures Launch Nears
- HYPE Price Outlook After Hyperliquid’s HIP-4 Rollout Sparks Prediction-Style Trading Boom


