Polygon Coin Could Slide To $1 As Multiple Hurdles Pressurize MATIC Buyers


On March 10th, the Polygon coin price bounced back from the combined support of $0.948 and 0.786 Fibonacci retracement level. This bullish reversal has surged the coin price by 20% in the last four days where it currently trades at the flipped resistance of $1.18. However, is the ongoing rally a resumption of a prior uptrend or just a temporary pullback before the next bear cycle hits?
Key Points
- The Polygon coin above the 200-day EMA reflects the overall price trend as bullish
- The $1.18 and $1.3 are crucial barriers that could restrict buyers to resume prior recovery.
- The intraday trading volume in the MATIC is $795.4 Million, indicating a 30% gain.
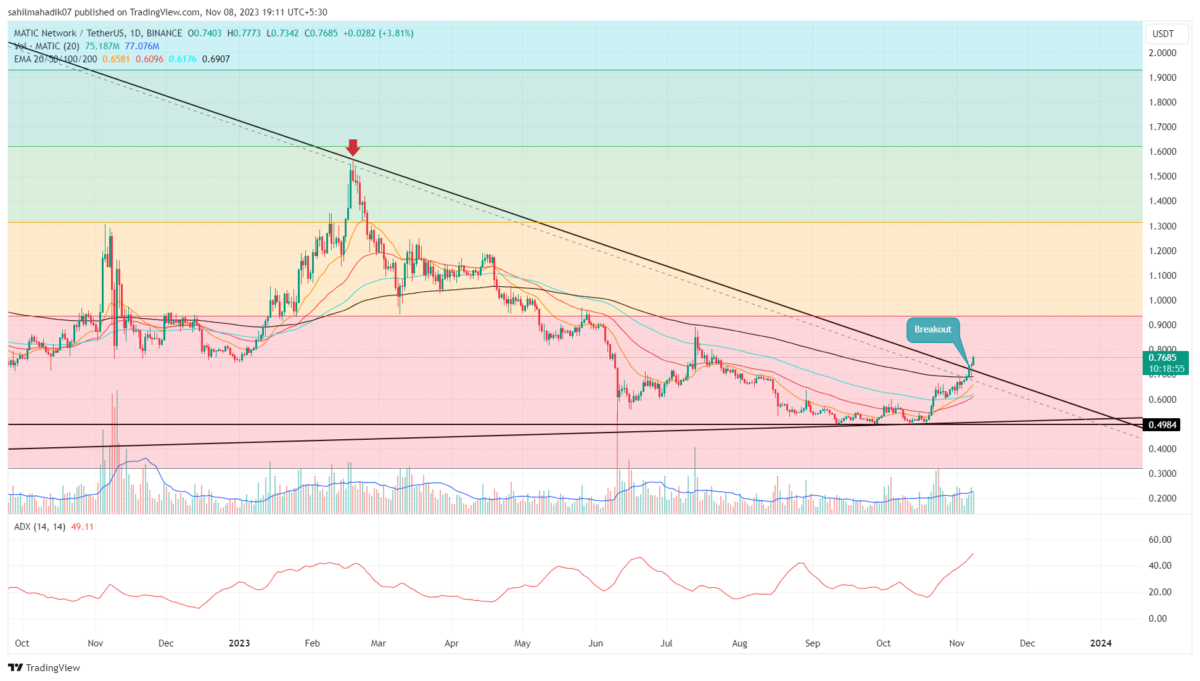
 Source- -Tradingview
A V-top reversal from the $1.53 peak showcased a directional downfall in the Polygon coin price. Over the past three weeks, this downfall tumbled the coin price by 38% and plunged it to 0.786 Fibonacci retracement level.
Though 0.786 FIB is a strong support zone, the coin price falling to such a low level during correction is a sign of weakness in bullish momentum. However, the buyers have recently managed to rebound from this support and push the prices to the $1.18 resistance.
By the press time, the MATIC price trades at $1.13 with an intraday loss of 1.39%. Considering the overall negative sentiment in the market, the currently bullish reversal is still to be assessed as a temporary pullback.
Also Read: What Is Regenerative Finance (Refi) And Who Is It For?
Thus, for prices to gain additional confirmation on the resumption of the uptrend, the buyers need to breach the $1.18 and $1.3 barriers.
On a contrary note, a possible reversal from $1.18 will encourage a revisit to $0.948 support.
Technical Indicators
EMAs: The 20-and-50-day EMAs on the verge of bearish crossover near the $1.18 level will create a strong barrier against the potential rise
MACD: the MACD and the signal line nearing a bullish crossover indicates the buying pressure is gradually rising
Polygon Coin Price Intraday Levels
- Spot rate: $1.13
- Trend: Bearish
- Volatility: Low
- Resistance levels- $1.18, and $1.3
- Support levels- $1.05 and $0.93

Why Trust CoinGape
CoinGape has covered the cryptocurrency industry since 2017, aiming to provide informative insights Read more…to our readers. Our journal analysts bring years of experience in market analysis and blockchain technology to ensure factual accuracy and balanced reporting. By following our Editorial Policy, our writers verify every source, fact-check each story, rely on reputable sources, and attribute quotes and media correctly. We also follow a rigorous Review Methodology when evaluating exchanges and tools. From emerging blockchain projects and coin launches to industry events and technical developments, we cover all facets of the digital asset space with unwavering commitment to timely, relevant information.