Polygon (MATIC) Price Prediction: MATIC Advances Above $1.50, But Lacks Conviction To Move Further


Polygon (MATIC) price rose for the second consecutive session on Wednesday. Investors find some attractive buying opportunities near double bottom formation around $1.40. More upside if the price is able to tag above the 200-day EMA (Exponential Moving Average) at $1.68.
- Polygon (MATIC) some remarkable gains on Wednesday.
- Triple bottom near $1.35 bounces the price toward 50-EMA.
- But Downside remains intact below $2.0.
The 15th largest cryptocurrency by market cap was last seen trading at $1.56 up 6.98% for the day.
MATIC needs to cross upside filters
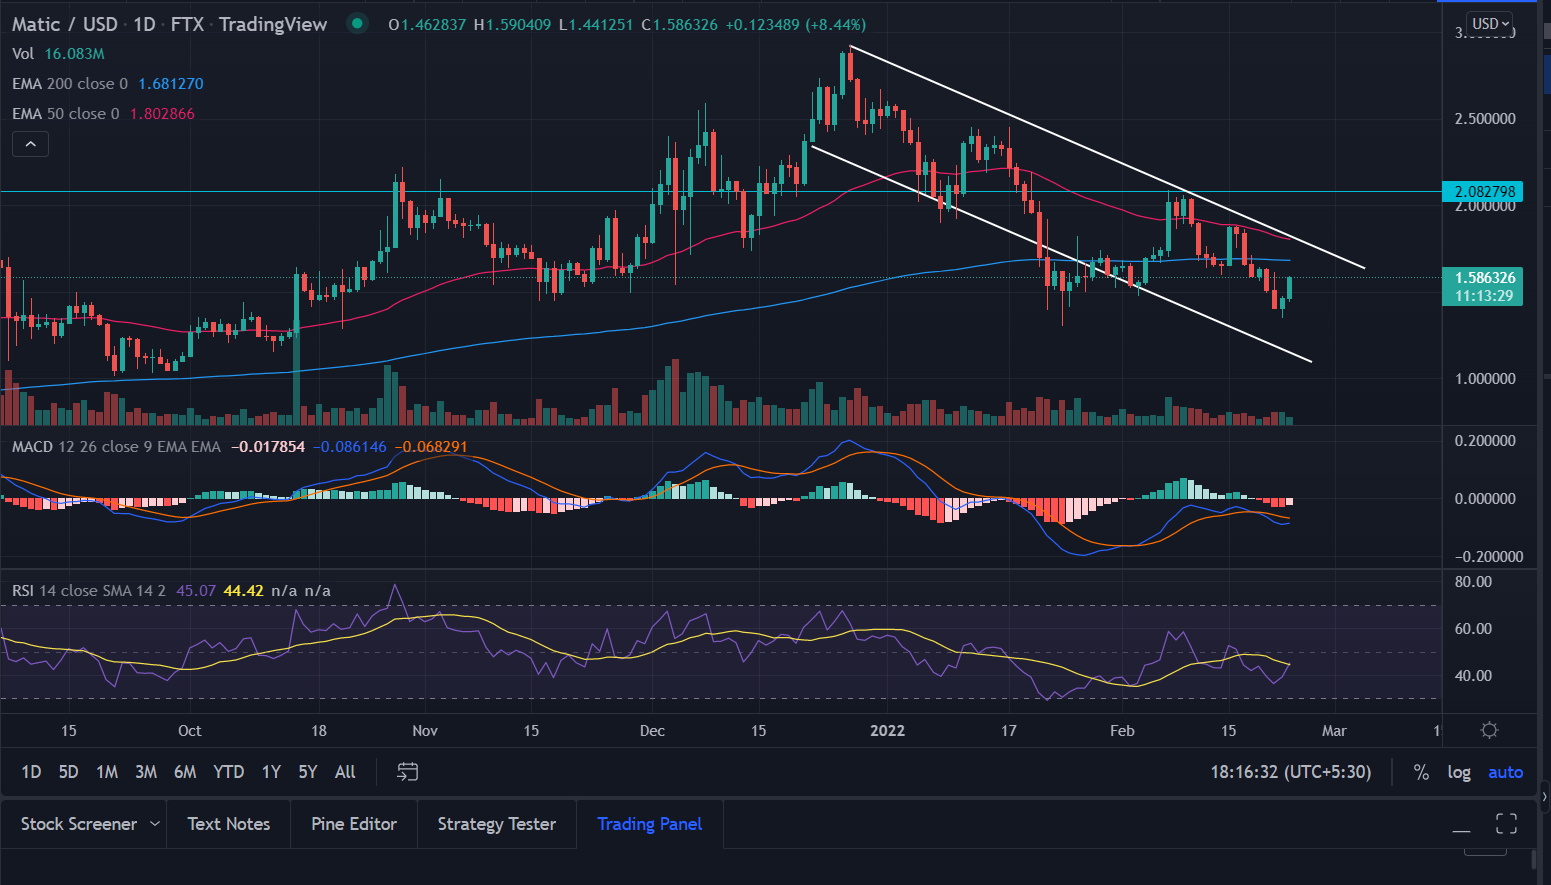
On the daily chart, Polygon (MATIC) has been trading in a downside channel with classic lower high lower low formation. After devaluating almost 55% from the record highs the price ultimately found some reliable support near the ‘Tripple bottom’ formation around $1.35.
Every time price tested the price level MATIC has seen significant gains since November. Inside the downward price channel, Polygon (MATIC) has sliced below the 50-day Exponential Moving Average (EMA) at $2.20.
Investors make an attempt to retest the 50-day moving average at $1.87 the price retraced 28% to the recent lows of $1.34. This also coincides with the formation of a ‘hammer’ candlestick, which is a bullish formation.
If the price is able to crosses the 50-day EMA, the next upside target is placed at the bearish slop line at $1.83.
A daily or weekly close above this level is essential to meet the psychological $2.0 level.
On the other hand, with a resurgence in the selling pressure, the price could move back to the lows made on Tuesday at $1.34.
Investors would next to keep an eye for $1.26, levels last seen in October.
Technical indicators:
RSI: The Daily Relative Strength Index (RSI) just move toward the moving average line with a bullish bias.
MACD: The Moving Average Convergence Divergence (MACD) still holds below the midline.

Why Trust CoinGape
CoinGape has covered the cryptocurrency industry since 2017, aiming to provide informative insights Read more…to our readers. Our journal analysts bring years of experience in market analysis and blockchain technology to ensure factual accuracy and balanced reporting. By following our Editorial Policy, our writers verify every source, fact-check each story, rely on reputable sources, and attribute quotes and media correctly. We also follow a rigorous Review Methodology when evaluating exchanges and tools. From emerging blockchain projects and coin launches to industry events and technical developments, we cover all facets of the digital asset space with unwavering commitment to timely, relevant information.