Polygon (MATIC) Skid 5%, downside Risk Remains At 20%


Polygon (MATIC) dropped more than 7% on Friday following the fall in the crypto market. At the time of writing, Polygon (MATIC) is trading at $1.84 with a 24-hour trading volume of $1,937,250368.
- Polygon price falls second straight day on Friday, diverging from the general market trend.
- Buyers could find attractive buy opportunities near lower levels.
- Skid lower after the news of a collaboration between global fashion brand Prada and Sports Company Adidas.
Bears sets eye on $1.60 on the daily chart
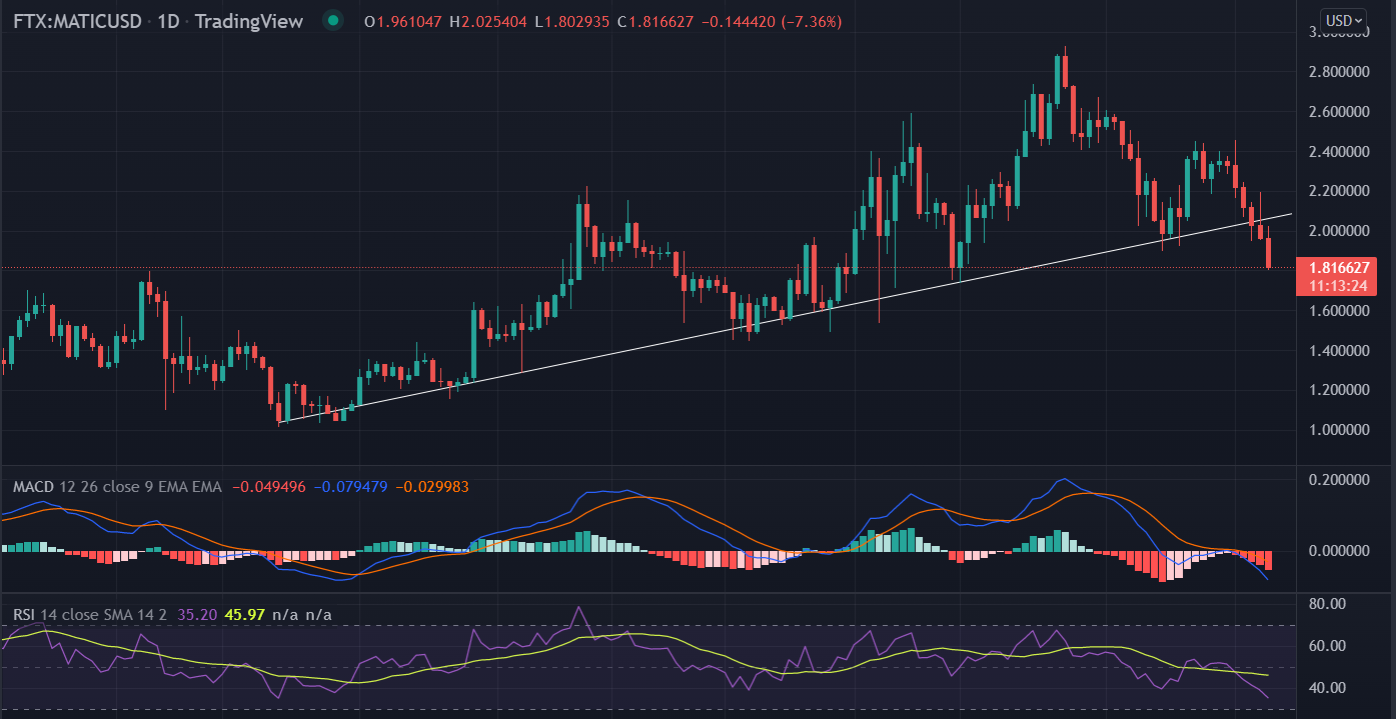
Technically speaking, the MATIC pair has broken a psychological level of $2.00000 and now hovering near the horizontal support line of $1.84.Polygon (MATIC) has risen more than 200% since September 21. Furthermore, the ascending trend line from the lows acts as a support for the buyers. The price has tested the bullish slop line four times and bounced back to make higher highs and higher lows. Now, the tested trend line has finally broken on January 20. This is giving scope for further downside in MATIC.
Looking at the momentum oscillator, the daily Relative Strength Index (RSI) has given the bearish crossover on January 12 where polygon formed a ‘ double top’ formation, which is a bearish reversal pattern.
The momentum is further confirmed by another oscillator, the MACD (Moving Average Convergence), which falls below the midline. All three factors strengthen the bearish outlook for the pair in the short term.
On the flip side, if the price holds near the horizontal support then it could see a technical bounce back to the recent highs of $2.0. An acceptance above the long term ascending line could meet the next target at $2.4

Why Trust CoinGape
CoinGape has covered the cryptocurrency industry since 2017, aiming to provide informative insights Read more…to our readers. Our journal analysts bring years of experience in market analysis and blockchain technology to ensure factual accuracy and balanced reporting. By following our Editorial Policy, our writers verify every source, fact-check each story, rely on reputable sources, and attribute quotes and media correctly. We also follow a rigorous Review Methodology when evaluating exchanges and tools. From emerging blockchain projects and coin launches to industry events and technical developments, we cover all facets of the digital asset space with unwavering commitment to timely, relevant information.

Related Articles


- Trump Tariffs: U.S. Supreme Court Sets February 20 for Potential Tariff Ruling
- Brazil Targets 1M BTC Strategic Reserve to Rival U.S. Bitcoin Stockpile
- Breaking: U.S. CPI Inflation Falls To 4-Year Low Of 2.4%, Bitcoin Rises
- Bitget Launches Gracy AI For Market Insights Amid Crypto Platforms Push For AI Integration
- BlackRock Signals $257M Bitcoin and Ethereum Sell-Off Ahead of Partial U.S. Government Shutdown
- Bitcoin Price Outlook As Gold And Silver Lose $3.6 Trillion in Market Value
- XRP and Ethereum Price Prediction as Trump Seeks to Lower Key Tariffs
- Solana Price Prediction as $2.6 Trillion Citi Expands Tokenized Products to SOL
- Bitcoin Price Could Fall to $50,000, Standard Chartered Says — Is a Crash Coming?
- Cardano Price Prediction Ahead of Midnight Mainnet Launch
- Pi Network Price Prediction as Mainnet Upgrade Deadline Nears on Feb 15


