Polygon Price Analysis: MATIC Consolidates Near $0.88; Hold Or Exit?


Polygon price analysis portrays consolidation at a higher level. The bulls failed to capitalize on the previous session’s gains as the price retreated below the crucial $0.95 mark. The formation of a ‘hammer’ candlestick on the hourly chart frame indicates the buying from the lower levels.
But the overall sentiment remained bearish. As of press time, MATIC/USD is reading at $$0.88, down 5.88% for the day. Further, the 24-hour trading volume gained 8% to $425,260,970 as per CoinMarketCap data. A jump in volume with a decline in price is a bearish sign.
- Polygon price erases all the previous gains and trades with a bearish bias.
- If the price drops below $0.88 it would bring more downside to MATIC.
- Short-term support was placed near the $0.86 level.
Polygon extends consolidation
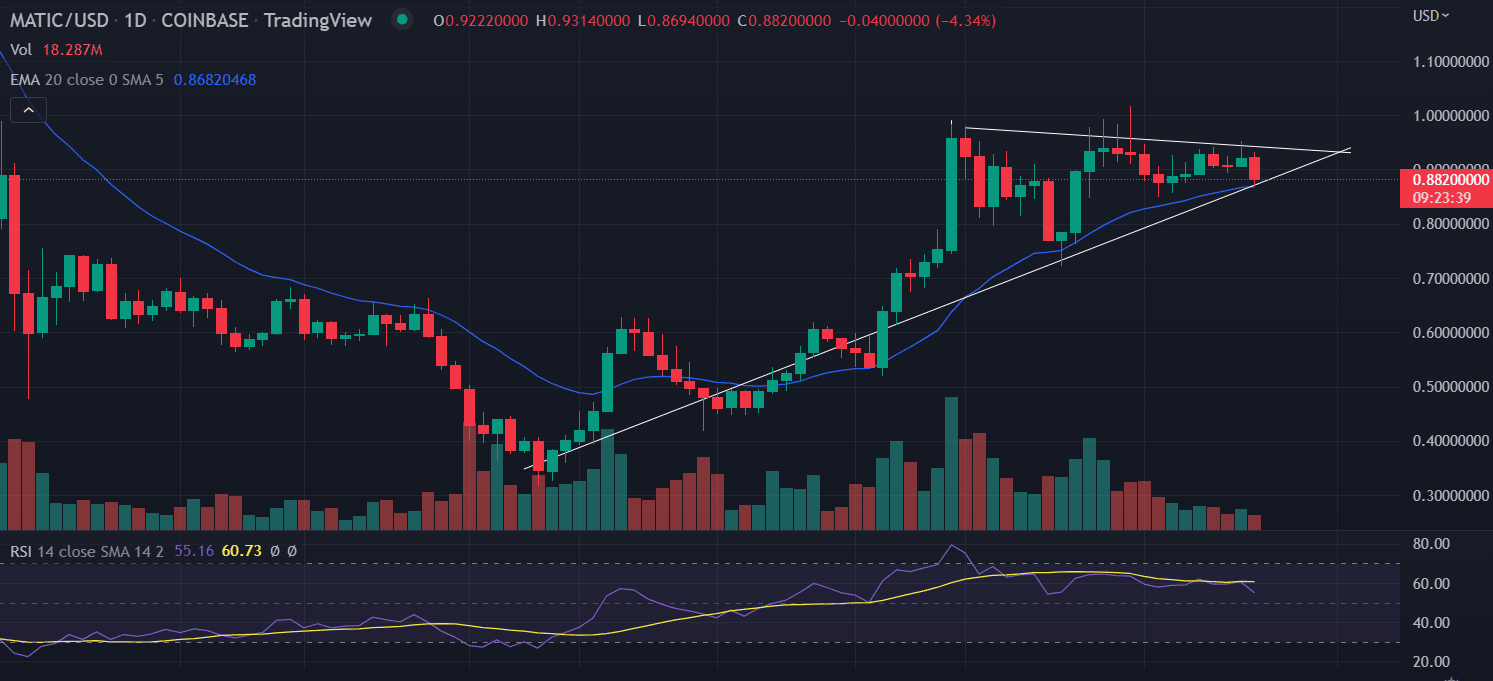
On the daily chart, the Polygon price traded in a range-bound manner from May 11 to July 17 while holding below $0.714. On July 18, the price gave a breakout above that range and gave a bullish momentum of up to $0.976.
The price trades along the bullish trend line from the lows of $0.41 since June 30. After making a swing high of $0.98, the price started to consolidate forming a symmetrical formation. Further, MATIC formed a “Double Top” pattern. According to this formation, if the price closes below $0.88, then we can expect a good fall of up to $0.79.
In addition to that, the trading volumes are trading below average for the past 3 weeks, as shown in charts, along with price trading in a range or slightly uptrend.
Polygon price is taking good support near the 20-day exponential moving average. That support is the only thing, that holds MATIC to don’t fall sharply in near future.
The RSI (14) is declining, indicating a probable downside momentum in the asset.
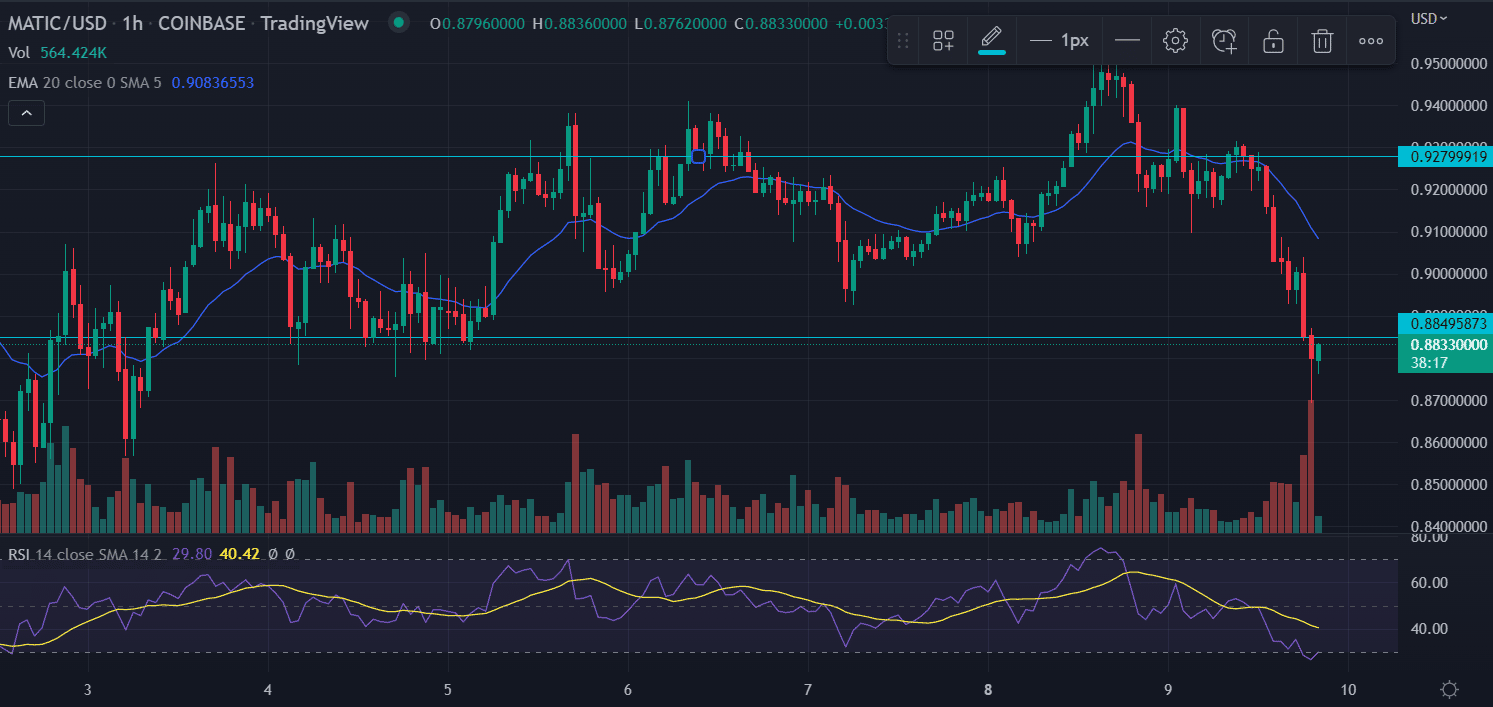
On the one-hour chart, the price fell shortly from the short-term consolidation that extends from $0.92 to $0.88. In today’s session, the price broke below the range for a brief period of time and is attempting to bounce back.
Also read: https://coingape.com/eth-whale-adds-312-billion-shiba-inu-tokens-amid-price-dip/
The momentum oscillator, RSI traded near the oversold territory, pointing to a sharp pullback in the price. Closing above $0.89 on an hourly basis could result in testing $0.90.
On the other hand, any downtick in the RSI would amplify the selling toward $0.85.
Conclusion:
Polygon price analysis suggests an extended consolidation in a range of $0.88-$0.90. The technical indicators suggest waiting for the construction levels before placing aggressive bids.

Why Trust CoinGape
CoinGape has covered the cryptocurrency industry since 2017, aiming to provide informative insights Read more…to our readers. Our journal analysts bring years of experience in market analysis and blockchain technology to ensure factual accuracy and balanced reporting. By following our Editorial Policy, our writers verify every source, fact-check each story, rely on reputable sources, and attribute quotes and media correctly. We also follow a rigorous Review Methodology when evaluating exchanges and tools. From emerging blockchain projects and coin launches to industry events and technical developments, we cover all facets of the digital asset space with unwavering commitment to timely, relevant information.
Related Articles


- Breaking: Bitcoin Bounces as U.S. House Passes Bill To End Government Shutdown
- Why Is The BTC Price Down Today?
- XRP’s DeFi Utility Expands as Flare Introduces Modular Lending for XRP
- Why Michael Saylor Still Says Buy Bitcoin and Hold?
- Crypto ETF News: BNB Gets Institutional Boost as Binance Coin Replaces Cardano In Grayscale’s GDLC Fund
- Ondo Price Prediction as MetaMask Integrates 200+ Tokenized U.S. Stocks
- XRP Price Risks Slide to $1 Amid Slumping XRPL Metrics and Burn Rate
- Gold and Silver Prices Turn Parabolic in One Day: Will Bitcoin Mirror the Move?
- Cardano Price Prediction as the Planned CME’s ADA Futures Launch Nears
- HYPE Price Outlook After Hyperliquid’s HIP-4 Rollout Sparks Prediction-Style Trading Boom
- Top 3 Meme coin Price Prediction: Dogecoin, Shiba Inu And MemeCore Ahead of Market Recovery


