Polygon Price Forecast: Will the Symmetrical Triangle Formation Spur a Bullish Trend?


Highlights
- The MATIC price retest to a two-long support triangle pattern could accelerate buying momentum.
- The supply pressure at $0.577 could prolong a sideways action throughout May Month.
- The intraday trading volume of the MATIC coin is $262.9 Million, showing a 19.5% gain.
Polygon Price Forecast: The majority of major cryptocurrencies witness an uncertain market sentiment as the Bitcoin price struggles to sustain above $65000. However, a few altcoins including the Polyong (MATIC) experienced a more negative influence resulting in a sharp correction since last week. From the $0.778 weekly resistance, the coin value tumbled 15% to currently trade at $0.658. Will the overhead supply push this downtrend below $0.6?
Also Read: Bitcoin Price: BTC To Face $2.7 Billion Liquidation If Price Hits This Level
Will the $0.656 Level Hold Amid Ongoing Correction?

MATIC, the native cryptocurrency on the Polygon network has been trading for over a month, limiting its price spread within $0.77 to $0.588 levels. With the broader market still in consolidation, the notable price swing in the daily chart indicates no clear momentum from bulls or ber towards the asset,
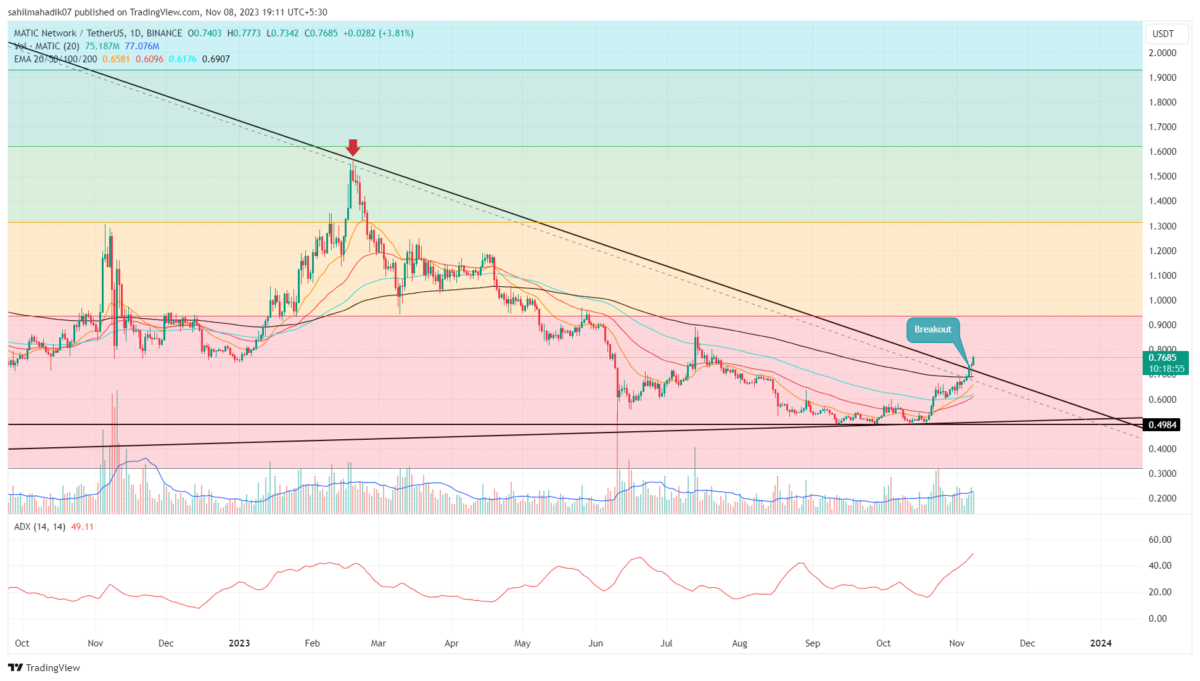
With an intraday loss of 1.3%, the MATIC price extended its prevailing correction trend to current traders at $0.656. With sustained selling, the altcoin could plunge another 8% and hit the lower trendline of a symmetrical triangle pattern.
This chart pattern with its two converging trend lines has been active since April 22, leading a long-term sideways trend in Polygon coin. However, as per the historical data, the coin price witnessed a renewed demand pressure at the lower trend, sufficient enough to lead a rally back up the upper boundary.
Thus, the potential downfall may offer a referral opportunity of the year and bolster buyers amid the $1.15 mark. However, the bullish recovery could face resistance between $0.77 and $0.953.
Having said that, the Polygon price could need a breakout from triangle formation to lead to a sustained bullish trend.
Technical Indicator
- BB Indicator: The squeezed range for the Bollinger Band indicates the heightened volatility in this asset.
- MACD: A potential bearish crossover between the MACD (blue) and signal (orange) lines below the midline indicates the supply pressure is active and may promote further downfall in MATIC.

Why Trust CoinGape
CoinGape has covered the cryptocurrency industry since 2017, aiming to provide informative insights Read more…to our readers. Our journal analysts bring years of experience in market analysis and blockchain technology to ensure factual accuracy and balanced reporting. By following our Editorial Policy, our writers verify every source, fact-check each story, rely on reputable sources, and attribute quotes and media correctly. We also follow a rigorous Review Methodology when evaluating exchanges and tools. From emerging blockchain projects and coin launches to industry events and technical developments, we cover all facets of the digital asset space with unwavering commitment to timely, relevant information.
24 Hours volume
$37.47K
Market Cap
$166.83M
Max Supply
10B