Polygon Price Prediction: Will Current Correction Push $MATIC Below $0.5?
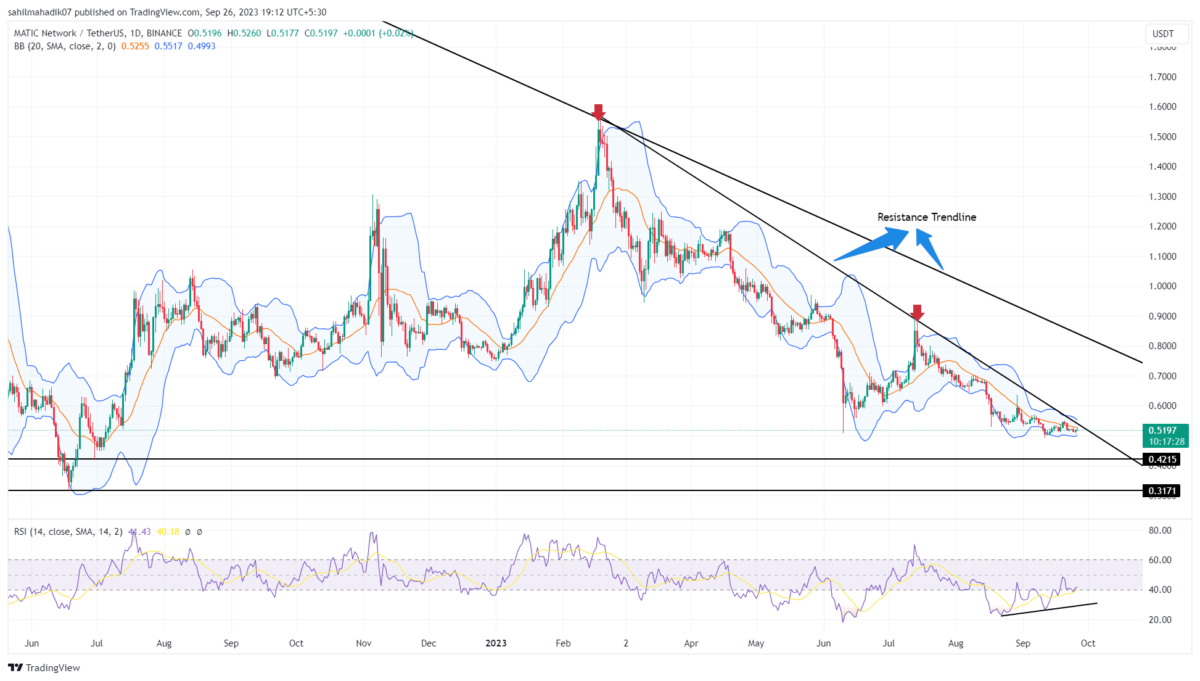
The Polyong coin price has majorly traded sideways throughout September, indicating an indecisiveness between buyers and sellers. Nevertheless, this lateral trajectory appears to be on a collision course with a key resistance trendline reclaimed intact since February 2023. The arrival at this critical juncture could catalyze an uptick in selling pressure, prompting traders to question: will Matic lose the $0.5 level amid the anticipated correction?
Also Read: Forget BlackRock, Here’s Why Gaming Industry Could Drive the Next Bitcoin Bull Run
Overhead Supply Hints Prolong Correction
- A potential reversal from the downsloping trendline may dump the price below $0.5
- A bullish breakout from the above trendline may signal a trend reversal
- The intraday trading volume of the MATIC coin is $195 Million, showing a 4.77% gain.
Since mid-July, the MATIC price has witnessed a steep correction, plummeting from a $0.89 high to its current price of $0.51—a 41.8% loss that effectively wiped out the gains made during the June-July rally. While the current market sentiment remains uncertain, the coin price is moving sideways and is about to hit a downsloping resistance trend line.
With this altcoin approaching a long-standing downtrend resistance line, it’s reasonable to anticipate increased selling pressure.
This third reversal from this trendline could trigger an 18% price decline, potentially dragging the coin price down to the next key support level at $0.42.
[converter id=”matic-polygon” url=”https://coingape.com/price/converter/polygon-to-usd/?amount=1″]
Can MATIC Price Recover Back to $0.69?
For those bullish on Polygon’s native coin, patience could be a virtue at this point. A daily close above the aforementioned resistance trendline would signify a pivotal shift in market sentiment, providing the bulls with suitable support to initiate a recovery rally. In the event of a successful breakout, the MATIC price could target initial resistance at $0.63, followed by a more ambitious target of $0.69
- Bollinger Band: The constricted range of the Bollinger Band indicator suggests heightened volatility for the asset in question.
- Relative Strength Index: The upward trajectory of the RSI slope signals that buyers are making efforts to overcome the overhead resistance level.
Recent Posts
- Price Analysis
Dogecoin Price Prediction Points to $0.20 Rebound as Coinbase Launches Regulated DOGE Futures
Dogecoin price has gone back to the spotlight as it responds to the growing derivatives…
- Price Analysis
Pi Coin Price Prediction as Expert Warns Bitcoin May Hit $70k After BoJ Rate Hike
Pi Coin price rose by 1.05% today, Dec. 18, mirroring the performance of Bitcoin and…
- Price Analysis
Cardano Price Outlook: Will the NIGHT Token Demand Surge Trigger a Rebound?
Cardano price has entered a decisive phase as NIGHT token liquidity rotation intersects with structural…
- Price Analysis
Will Bitcoin Price Crash to $74K as Japan Eyes Rate Hike on December 19?
Bitcoin price continues to weaken after breaking below its recent consolidation range, now trading within…
- Price Analysis
Bitwise Predicts Solana Price Will Hit New All-Time Highs in 2026
Solana price declined by 4% over the past 24 hours, breaking below the key $130…
- Price Analysis
Bitcoin Price Outlook: Capriole Founder Warns of a Drop Below $50K by 2028
Bitcoin price narratives continue to evolve as long-term downside risks regain attention. Bitcoin price discussions…