Polygon(MATIC) Price Ready To Take Out $2.45, Are You Buying AT Current Levels!


Polygon (MATIC) price has shown remarkable recovery after a few weeks of consolidation. The price surged nearly 60% from the January lows. Today is not an exception but investors face some upside pressure near the crucial $2.0 level.
As of press time, MATIC/USD is trading at $2.01, up 3.85% for the day. Polygon records a drop in volume at $1.4 billion with the current market cap of $15 billion as per the CoinmarketCap.
- Polygon (MATIC) books gains on Wednesday.
- The price struggles below 50 SMA at $2.09.
- The momentum oscillator favors the current upside momentum.
MATIC faces a decisive point on the daily chart
Polygon (MATIC) has been rising from the lows of $1.46, which also happens to be the double support for the price. This level was first tested by the bulls in November after retracting more than 30% from October’s high. Investors enters into a short-term upside momentum and touched all-time highs at $2.92 on December 27.
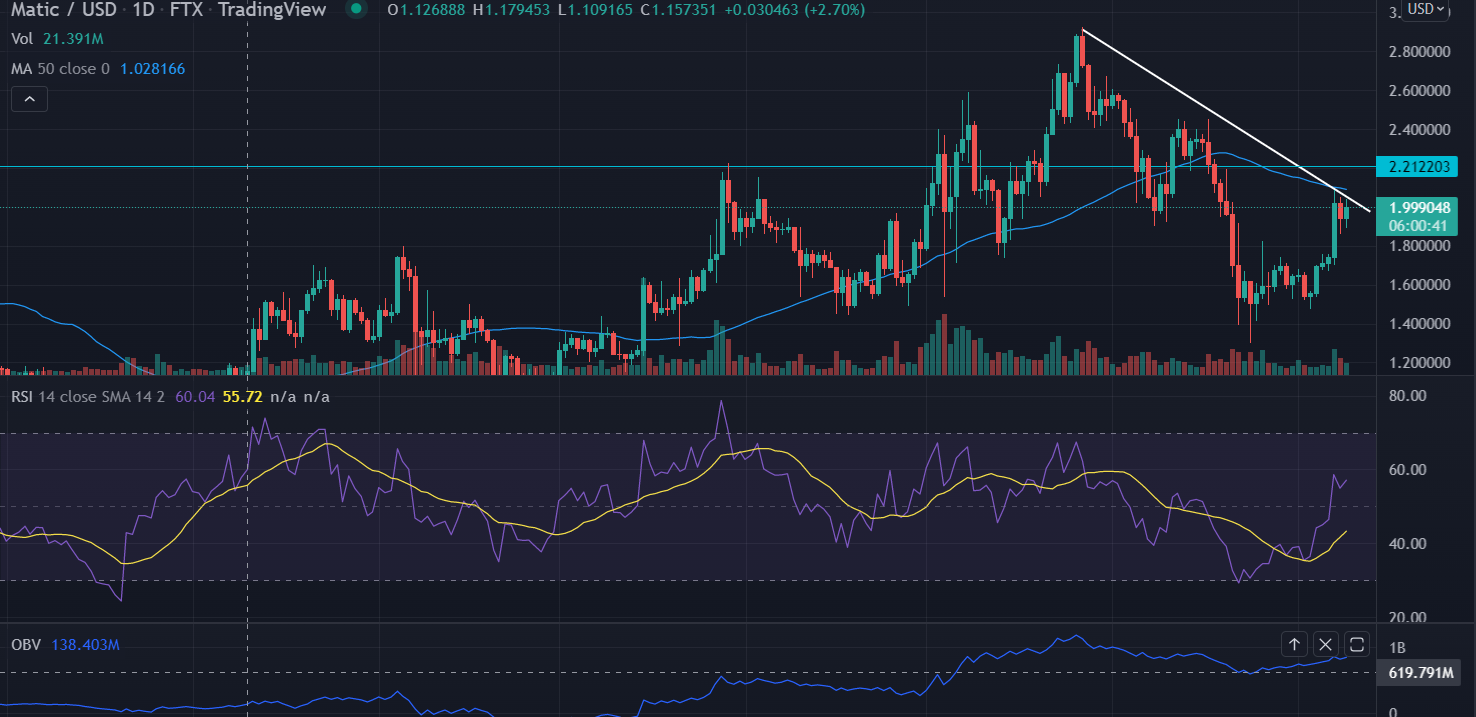
However, MATIC has lost 55% in total volumes and once again tested the supply zone near $1.46. Now, the descending trend line from the mentioned high level is acting as a strong barrier for the pair.
Furthermore, the price is already struggling below the 50-SMA that is exerting selling pressure on MATIC. Bulls need to decisively pierce the bearish slopping line to continue with the current bullish bias.
The Daily Relative Strength Index (RSI) trades at 57, which signals at the underlying bullish sentiment. Any uptick in the momentum indicator could push MATIC towards the horizontal resistance line at $2.20 followed by the $2.40 psychological level.
On the flip side, a failure to hold the session’s low level would invalidate the bullish theory and will result in the meeting the lows made on Monday at $1.69.

Why Trust CoinGape
CoinGape has covered the cryptocurrency industry since 2017, aiming to provide informative insights Read more…to our readers. Our journal analysts bring years of experience in market analysis and blockchain technology to ensure factual accuracy and balanced reporting. By following our Editorial Policy, our writers verify every source, fact-check each story, rely on reputable sources, and attribute quotes and media correctly. We also follow a rigorous Review Methodology when evaluating exchanges and tools. From emerging blockchain projects and coin launches to industry events and technical developments, we cover all facets of the digital asset space with unwavering commitment to timely, relevant information.

Related Articles


- Trump’s Truth Social Files For Bitcoin, Ethereum, Cronos Crypto ETFs Amid Institutional Outflows
- Trump Tariffs: U.S. Supreme Court Sets February 20 for Potential Tariff Ruling
- Brazil Targets 1M BTC Strategic Reserve to Rival U.S. Bitcoin Stockpile
- Breaking: U.S. CPI Inflation Falls To 4-Year Low Of 2.4%, Bitcoin Rises
- Bitget Launches Gracy AI For Market Insights Amid Crypto Platforms Push For AI Integration
- Bitcoin Price Outlook As Gold And Silver Lose $3.6 Trillion in Market Value
- XRP and Ethereum Price Prediction as Trump Seeks to Lower Key Tariffs
- Solana Price Prediction as $2.6 Trillion Citi Expands Tokenized Products to SOL
- Bitcoin Price Could Fall to $50,000, Standard Chartered Says — Is a Crash Coming?
- Cardano Price Prediction Ahead of Midnight Mainnet Launch
- Pi Network Price Prediction as Mainnet Upgrade Deadline Nears on Feb 15


