Ripple (XRP) Price Roars Towards $0.8350 Moves In Upward Channel


XRP has lost almost 17% since January 2 from the highs of $0.8659. The price gains more than 1% on Saturday from the lows of $0.7680. At the time of writing, the XRP price has been hovering near higher levels.
- XRP extends the previous session’s gains today with more than 1% gains.
- The Altcoin rises from $0.71351 but struggles near $0.7870.
- Trading volume loses 35.4$ in the past 24-hours.
Ripple (XRP) creeps higher in parallel channel
The parallel channel extends from the lows of Jan 10 at $0.6984 and finds the price faces some resistance near $0.7950 on January 13. This also coincides with the formation of a “Doji” candlestick, which results in the price correction towards the lower trendline of the channel. However, buyers make a comeback and push up XRP above 50-hour SMA (Simple Moving Average) but fall short below the 100-day SMA $0.7935.
Volumes are supportive of the current price movement. The market cap in the last 24-hour has built up more than 1% and stands at $37,298,200,534.
Moving on to the technical indicators, the RSI (Relative Strength Index) trades at 53 with a bullish crossover. Furthermore, the MACD (Moving Average Convergence Divergence) also supports the bullish argument. The unbounded oscillator trades above the midline that is helping the bulls find the ground. A decisive break above the 100-day SMA would open the doors for the next upside target at 200-day SMA that is placed at $0.8335. Ripple’s (XRP) price has been consolidating in a trading range of $0.6980 and $0.7900 since January 6. A fresh round of buying could emerge if the price closes above the highs of January 6 at $ 0.8022.
On the other hand, the downside would resume if the price fails to sustain the lower trend line of the upside channel. Interim support is placed at the beginning of the channel at $0.7131.
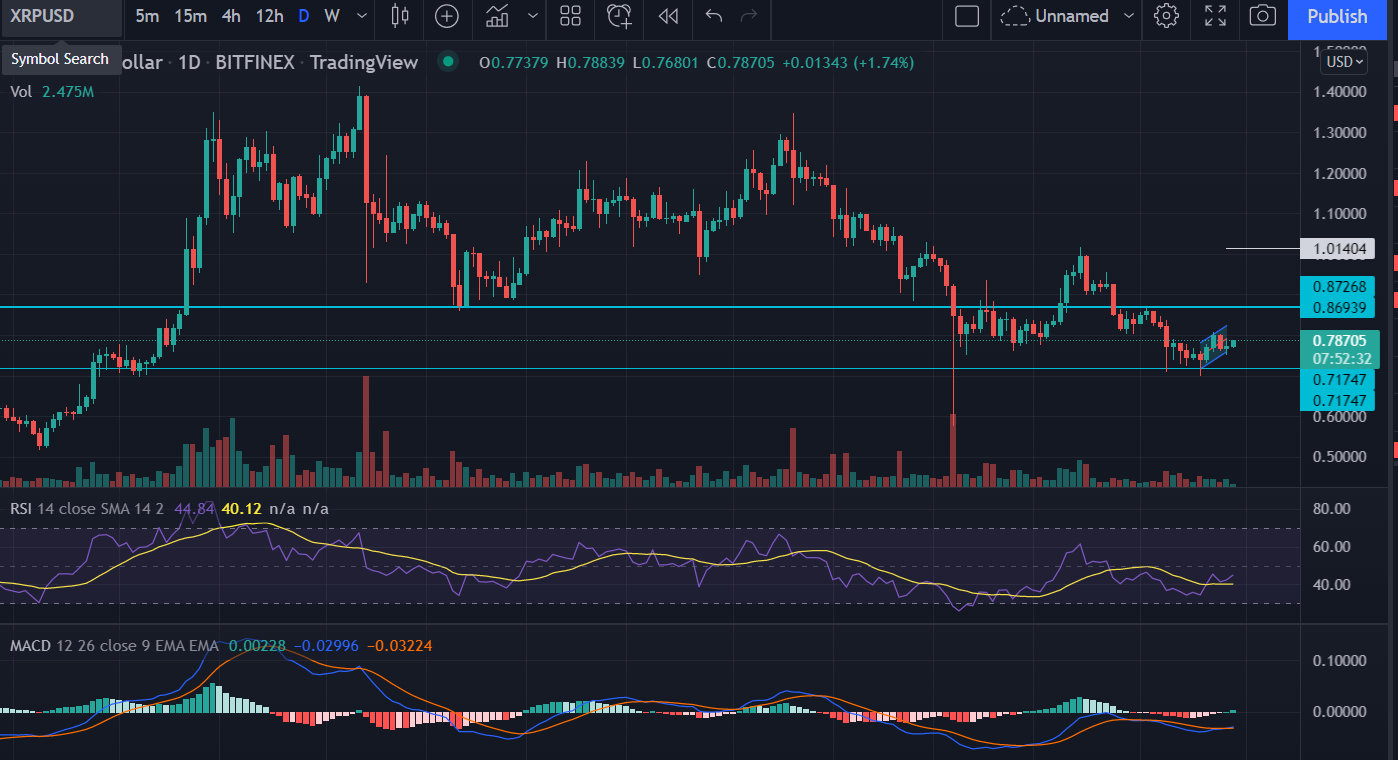
As can be seen on the daily time frame, the MACD still holds below the midline while RSI stands at 44. The probability of the next lower level at the low of July at $0.6308 would strengthen on a daily close below January 10 low.

Why Trust CoinGape
CoinGape has covered the cryptocurrency industry since 2017, aiming to provide informative insights Read more…to our readers. Our journal analysts bring years of experience in market analysis and blockchain technology to ensure factual accuracy and balanced reporting. By following our Editorial Policy, our writers verify every source, fact-check each story, rely on reputable sources, and attribute quotes and media correctly. We also follow a rigorous Review Methodology when evaluating exchanges and tools. From emerging blockchain projects and coin launches to industry events and technical developments, we cover all facets of the digital asset space with unwavering commitment to timely, relevant information.
Related Articles


- $3.5T Banking Giant Goldman Sachs Discloses $2.3B Bitcoin, Ethereum, XRP, and Solana Exposure
- Why is XRP Price Dropping Today?
- Breaking: FTX’s Sam Bankman-Fried (SBF) Seeks New Trial Amid Push For Trump’s Pardon
- Fed’s Hammack Says Rate Cuts May Stay on Hold Ahead of Jobs, CPI Data Release
- $800B Interactive Brokers Launches Bitcoin, Ethereum Futures via Coinbase Derivatives
- Bitcoin Price Analysis Ahead of US NFP Data, Inflation Report, White House Crypto Summit
- Ethereum Price Outlook As Vitalik Dumps ETH While Wall Street Accumulates
- XRP Price Prediction Ahead of White House Meeting That Could Fuel Clarity Act Hopes
- Cardano Price Prediction as Bitcoin Stuggles Around $70k
- Bitcoin Price at Risk of Falling to $60k as Goldman Sachs Issues Major Warning on US Stocks
- Pi Network Price Outlook Ahead of This Week’s 82M Token Unlock: What’s Next for Pi?


