Rising Stellar Price Aims For $0.13 Mark; Buy Now?
The rising Stellar (XLM) price projects a recovery possibility with a double bottom pattern at the $0.1 mark. With sustained buying, the bulls will retest the neckline resistance of $0.15 after a 3.3% rally. However, this low volume recovery lessens the confidence for a bullish breakout, and thus, the interested buyer should wait for a daily candle closing above neckline.
Key points:
- A double bottom pattern will assist buyers in rechallenging the $0.15 resistance
- A possible reversal from the neckline resistance will invalidate the bullish pattern
- The intraday trading volume in the XLM is $107.9 Million, indicating a 31.4% gain.
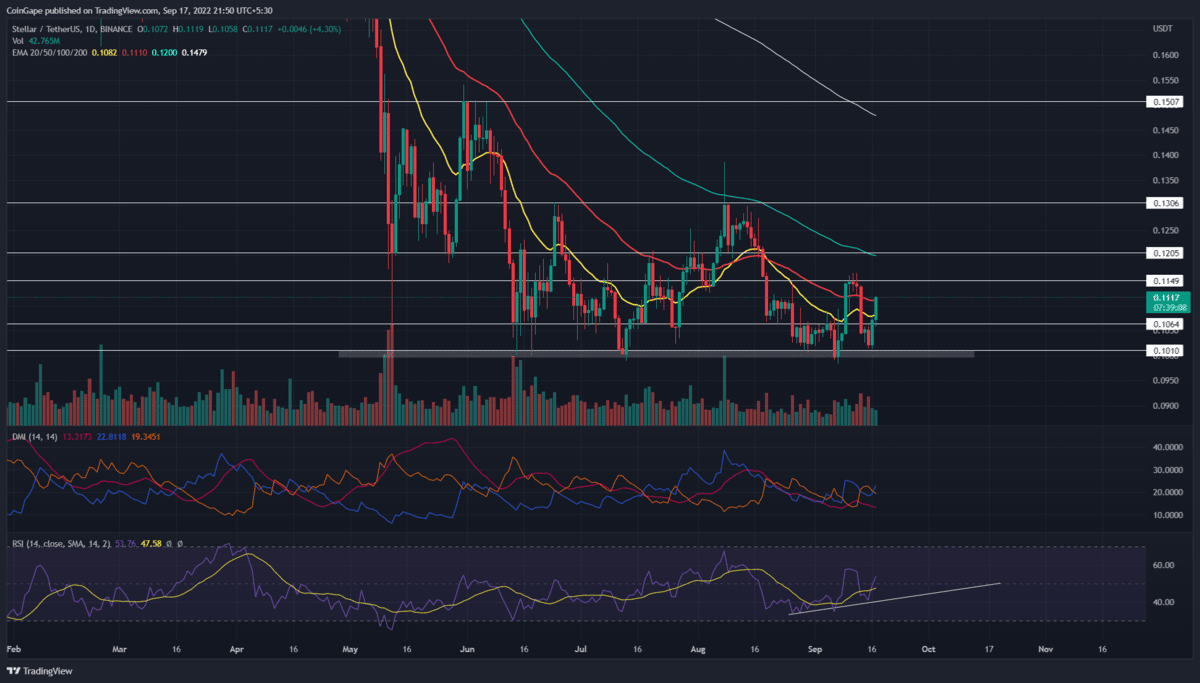
The XLM/USDT pair has been in a range-bound rally for the past three months. Furthermore, the $0.13 resistance and $0.1 support acted as the crucial barrier, which limited the price action to a confined range.
Amid the recent sell-off in the crypto market, the XLM price revisited the bottom support of $0.1. However, the price rebounded from this support with a massive bullish candle, indicating the traders are still actively buying at this level.
This reversal indicates a new bull cycle within this range, which sets a potential bull run to a range resistance of $0.13. Though the destination is marked, the Stellar price currently trades at $0.11 and is gradually rising to the $0.15 supply zone.
Concerning this resistance, the daily technical chart shows a double bottom pattern formation in the daily time frame chart. In response to this pattern, the buyers should surpass this neckline resistance.
A breakout entry from the $0.115 resistance should accelerate the bullish momentum and drive the prices 14% higher to the $0.13 resistance.
However, the volume activity lags despite a strong recovery, indicating a slight weak in bullish momentum. A bearish reversal from the $0.115 resistance will keep the prices wavering at the $0.1 bottom support.
Technical Indicator
RSI: the XLM buyers maintain an uptrend in the underlying bullishness evident by the ascending trendline highlighting the Bullish divergence. Therefore, the indicator signals an Upcoming breakout entry opportunity for sideline buyers.
DMI indicator: the Bullish crossover in the DI lines reverses the bearish alignment quickly after the previous event, sabotaging the trend control. However, the falling trend momentum evident by the falling ADX line questions the breakout rally’s strength.
- Resistance levels: $0.115 and $0.12
- Support levels: $0.1064 and $0.1
Recent Posts
- Price Analysis
Pi Coin Price Prediction as Expert Warns Bitcoin May Hit $70k After BoJ Rate Hike
Pi Coin price rose by 1.05% today, Dec. 18, mirroring the performance of Bitcoin and…
- Price Analysis
Cardano Price Outlook: Will the NIGHT Token Demand Surge Trigger a Rebound?
Cardano price has entered a decisive phase as NIGHT token liquidity rotation intersects with structural…
- Price Analysis
Will Bitcoin Price Crash to $74K as Japan Eyes Rate Hike on December 19?
Bitcoin price continues to weaken after breaking below its recent consolidation range, now trading within…
- Price Analysis
Bitwise Predicts Solana Price Will Hit New All-Time Highs in 2026
Solana price declined by 4% over the past 24 hours, breaking below the key $130…
- Price Analysis
Bitcoin Price Outlook: Capriole Founder Warns of a Drop Below $50K by 2028
Bitcoin price narratives continue to evolve as long-term downside risks regain attention. Bitcoin price discussions…
- Price Analysis
XRP Price Rare Pattern Points to a Surge to $3 as ETFs Cross $1B Milestone
XRP price dropped by 1.2% today, Dec. 17, continuing a downward trend that started in…