Rounding Bottom Pattern Sets MANA For A Potential Upswing Of 10.5%


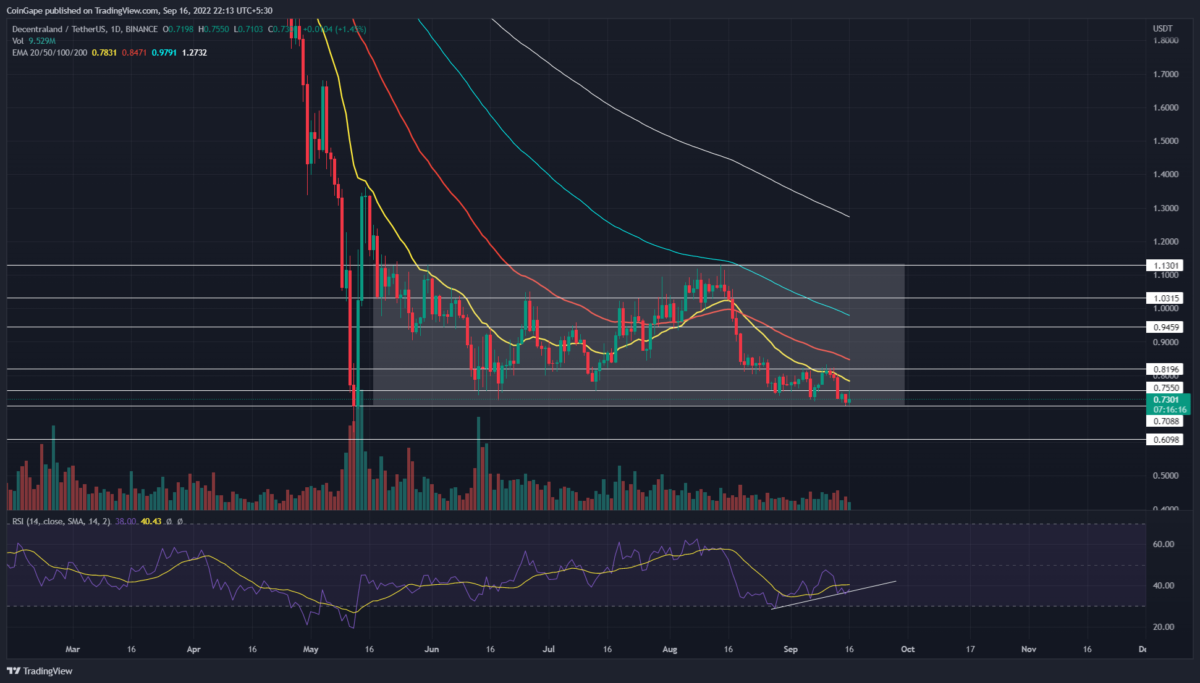
Following the August second-half sell-off, the MANA/USDT pair slumped to the June-July bottom support of $0.75. The downfall registered a loss of nearly 32.5%. Furthermore, on August 29th, the coin price rebounded from this support with a bullish engulfing candle indicating the traders are actively buying at this level.
Key points:
- The recent correction phase entirely evaporated the June-July recovery gains
- The MANA price forms a rounding bottom pattern in the four-hour time frame chart.
- The 24-hour trading volume in the Decentraland token is $128.8 Million, indicating a 60.6% rise.
 Source-Tradingview
Since last week, the MANA price has walked a lateral path, trying to sustain above the $0.75 support. Thus, on September 4th, the meta coin gave a bullish breakout from the range resistance of $0.8, suggesting the buyers are making a recovery attempt.
MANA Chart Hints Formation Of Rounding Bottom Pattern
 Source- Tradingview
The four-hour time frame chart accentuates the range breakout with $0.8 resistance. The MANA price is currently wobbling in the retest phase offering an entry opportunity for interest traders. However, the higher price rejection attached to the retest candle reflects a slight weakness in bullish commitment.
If the MANA price sustains above the $0.8 mark, the potential rally could surge 6.8% higher to hit $0.86. Moreover, the bull run will bolster the formation of a rounding bottom pattern. This bullish pattern will further encourage further recovery and breach the $0.86 mark.
On a contrary note, If the MANA buyers couldn’t hold above the $0.8 mark and close a candle, closing below the flipped support will signal a fake breakout. As a result, the price could tumble back to $0.75 support.
Technical indicator
RSI indicator(4-hour): the RSI slope showed an evident bullish divergence during the range-bound rally, and a surge above the midline indicates growth in bullish momentum.
EMAs: the 20 and 50 EMAs are on the verge of bullish crossover at the $0.793 mark. This crossover could encourage the breakout rally to hit $0.856, and the long traders can put their stop loss just below these EMAs.
- Resistance levels: $0.86 and $0.89
- Support levels: $0.8 and $0.753

Why Trust CoinGape
CoinGape has covered the cryptocurrency industry since 2017, aiming to provide informative insights Read more…to our readers. Our journal analysts bring years of experience in market analysis and blockchain technology to ensure factual accuracy and balanced reporting. By following our Editorial Policy, our writers verify every source, fact-check each story, rely on reputable sources, and attribute quotes and media correctly. We also follow a rigorous Review Methodology when evaluating exchanges and tools. From emerging blockchain projects and coin launches to industry events and technical developments, we cover all facets of the digital asset space with unwavering commitment to timely, relevant information.

Related Articles

- CLARITY Act: Crypto Group Challenges Banks Proposal With Its Own Bill Suggestions
- Trump’s Truth Social Files For Bitcoin, Ethereum, Cronos Crypto ETFs Amid Institutional Outflows
- Trump Tariffs: U.S. Supreme Court Sets February 20 for Potential Tariff Ruling
- Brazil Targets 1M BTC Strategic Reserve to Rival U.S. Bitcoin Stockpile
- Breaking: U.S. CPI Inflation Falls To 4-Year Low Of 2.4%, Bitcoin Rises
- XRP Price Prediction Ahead of Potential U.S. Government Shutdown Today
- Bitcoin Price Outlook As Gold And Silver Lose $3.6 Trillion in Market Value
- XRP and Ethereum Price Prediction as Trump Seeks to Lower Key Tariffs
- Solana Price Prediction as $2.6 Trillion Citi Expands Tokenized Products to SOL
- Bitcoin Price Could Fall to $50,000, Standard Chartered Says — Is a Crash Coming?
- Cardano Price Prediction Ahead of Midnight Mainnet Launch


