

SHIB Price Break Below Monthly Support Hints a Quick 8% Fall


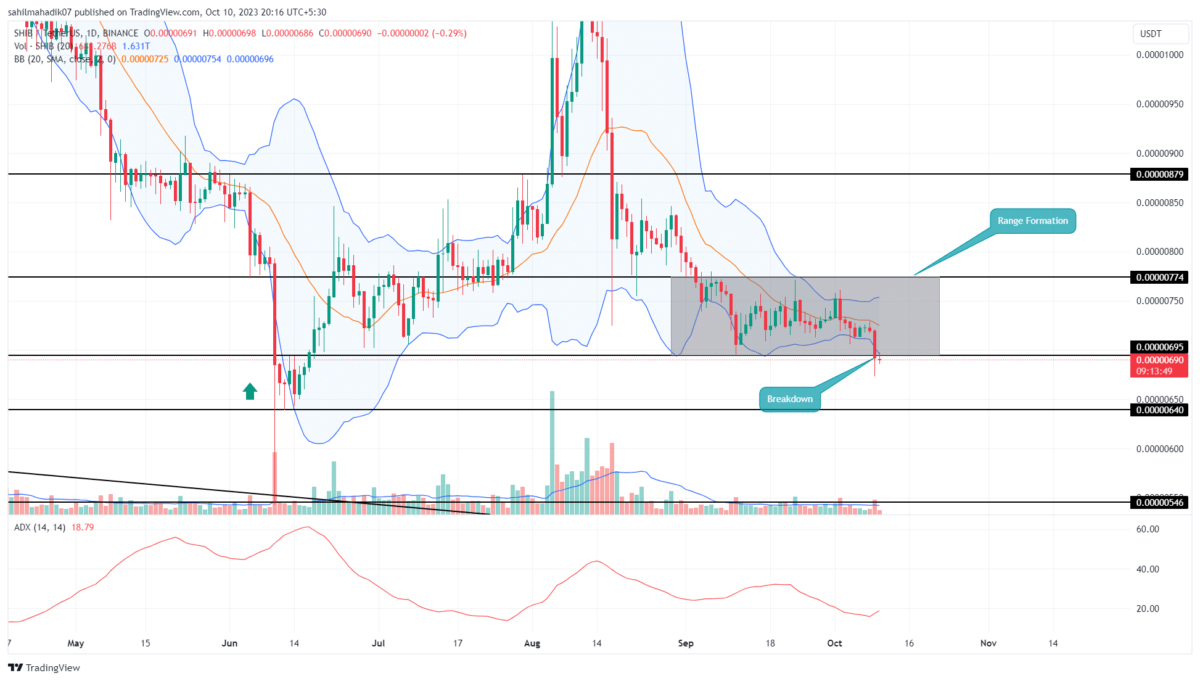
Since the onset of October, the SHIB price has been grappling with heightened selling pressure, culminating in a pronounced decline on the daily chart. From its last upswing of $0.00000761, the coin’s value has plummeted by 7.6%, landing at a current valuation of $0.0000067. Alarmingly, amidst this downturn, the token has slipped beneath the foundational support of its month-long consolidation phase, hinting at the potential for an extended bearish trajectory.
Also Read: Bad Idea AI & Tangem Collaboration Ignites SHIB Community Buzz
Is SHIB Price Heading to $0.000006?
- A $0.000007 support breakdown ended a month-long consolidation in the seller’s favor
- The falling price could face an intense supply zone at $0.0000064 and $0.0000054.
- The intraday trading volume of the Shiba Inu coin is $81.5 Million, showing a 10% gain.
 Source- Tradingview
In the last five weeks, the Shiba Inu price oscillated between the confines of $0.00000774 and $0.000007 horizontal level, forming a sideways pattern. This consolidative phase emerged in the aftermath of August’s stark drop, seemingly recuperating the exhausted bearish momentum.
However, given the prevailing bearish undertones enveloping the crypto sector, the SHIB price registered a notable break below the established lower bound on October 9th. With an intraday loss of 0.72%, the crypto sellers project a follow-up to the bearish breakdown yesterday.
If this selling pressure persists, the asset could further diminish by approximately 7%, aiming for the next support target at $0.0000064. Such a decline would also push the SHIB price below the 78.6% Fibonacci retracement level, a significant threshold derived from its June-July ascent.
A definitive breach here could amplify bearish sentiment, propelling the asset towards a deeper correction level of $0.0000055.
SHIB vs BTC Performance
 Source: Coingape| Shiba Inu Price Vs Bitcoin Price
Contrastingly, a comparative analysis of Bitcoin and Shiba Inu unveils divergent price actions over the past quarter. Since late August, the Bitcoin price has started a new relief rally to regain its lost ground whereas the SHIB coin continues to prolong the downward trajectory. with the current weakness in this meme coin, the coin holders may witness even deeper corrections if the broader market sentiment remains bearish,
- Bollinger Band: The coin price challenges the lower band of the Bollinger band indicator suggesting active bearish momentum.
- Average Directional Index: An uptick in the daily ADX slope reflects the seller’s strength to lead to further downfall.

Why Trust CoinGape
CoinGape has covered the cryptocurrency industry since 2017, aiming to provide informative insights Read more…to our readers. Our journal analysts bring years of experience in market analysis and blockchain technology to ensure factual accuracy and balanced reporting. By following our Editorial Policy, our writers verify every source, fact-check each story, rely on reputable sources, and attribute quotes and media correctly. We also follow a rigorous Review Methodology when evaluating exchanges and tools. From emerging blockchain projects and coin launches to industry events and technical developments, we cover all facets of the digital asset space with unwavering commitment to timely, relevant information.
Premium Partners


Related Articles


- Crypto Regulation in South Korea Stalls as US-Inspired Stablecoin Rules Hits Dead End
- Breaking: Metaplanet Buys $451M in Bitcoin, Stock Price Tanks
- Breaking: Hyperliquid Rival Lighter Announces LIT Token Launch Amid Rising Demand
- Binance Tops CME in Bitcoin Futures Open Interest Amid Institutional Selloffs
- What To Expect in Crypto Market in 2026? Haseeb Qureshi Explains
- Why Bitcoin, Ethereum, XRP, and ADA Prices Are Falling Today
- Is XRP Price Preparing for Trend Reversal as ETF Inflows Extend to a 7th Straight Week?
- Binance Coin Price Risks Crash to $700 as Key BSC Metric Plunges 80%
- SUI Price Forecast: What’s Next for SUI in 2026 After $78.9M Token Unlocks?
- Solana Price Prediction: How High Could SOL Go in January 2026?
- Top 3 Predictions for Bitcoin price, Ethereum price and XRP price for 2026 According to Analysts


