SHIB Price Prediction: Triangle Setup Hints 8% Drop in Near Term
In the wake of volatile market sentiment, the Shiba Inu coin price has been navigating choppy waters. From August 30th, the coin price significantly dropped from a $0.000846 swing high and plunged to the $0.000000739 mark. After registering a 12.65% loss, the price action turned sideways in response to increasing uncertainty in the crypto market. However, a closer look at the four-time frame chart reflects this consolidation as forming a pennant pattern.
Also Read: SHIB Price Prediction: Shiba Inu Shows Signs Of New Lifeline, But There’s A Catch
Bearish Pennant Hints Continuation of Downward Trend.
- The Shib price narrowing within two trend lines will lead to a decisive breakout
- A breakdown below the support trendline could tumble the prices by 8%.
- The intraday trading volume of the Shiba Inu coin is $94 Million, showing a 5.7% gain.
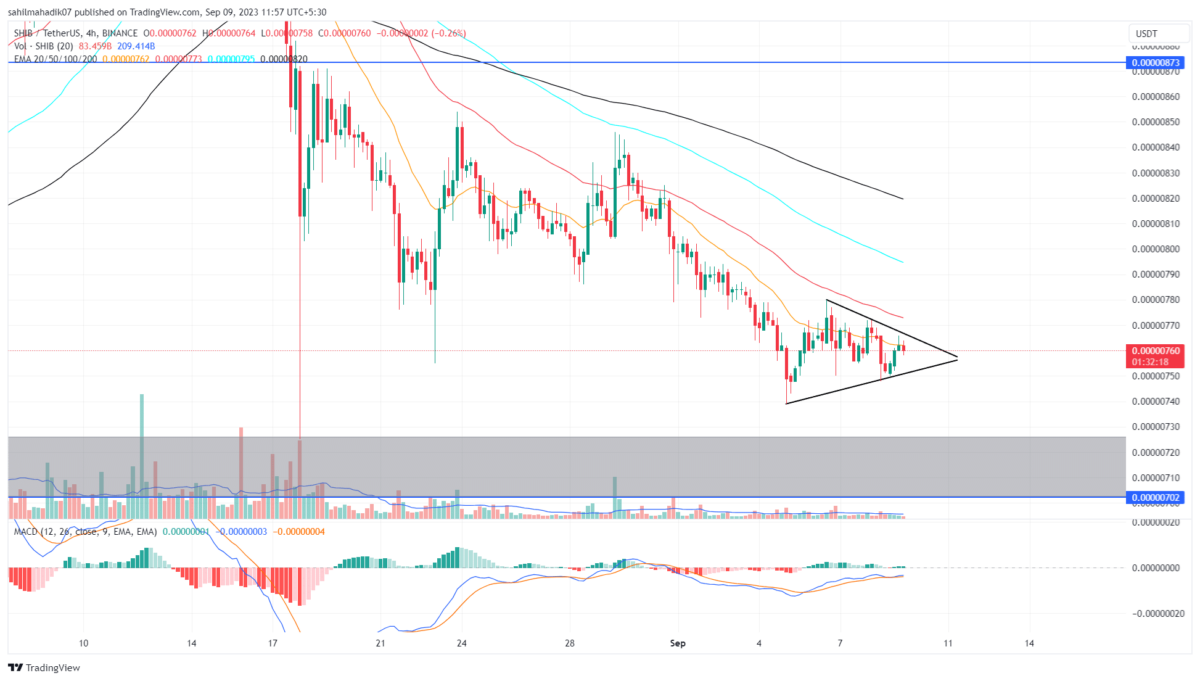
A keen look in the 4-hour timeframe shows a better picture of the bearish pennant pattern. For the past week, the Shiba Inu coin seems to be dancing on a tightrope, oscillating between two converging trend lines that define this pattern.
At the time of writing, the altcoin valuation sits at $0.00000759, suffering a 0.2% intraday blow. Amplifying this bearish narrative are the high price rejection candles evident at the upper resistance, suggesting another bearish reversal on the horizon. This reversal would hint to extension of sideways movement.
However, gauging the prevailing sentiment, sellers might soon take the reins, potentially steering the coin beneath the pennant’s lower trendline. Should this bearish prophecy materialize, we could see the Shiba Inu price plunge 8%, testing the $0.000007 support.
Can SHIB Price Rise Back to $0.0000085?
While a bearish thesis seems valid for the SHIB price, the triangle pattern holds the possibility to reverse the prior trend. Therefore, if the coin price breaks above the upper trendline, the buyers may lead to a significant upswing, leading to $0.0000085.
- Bollinger Band: The narrow range of Bollinger band indicators accentuates indecisiveness sentiment among traders
- Moving Average Convergence Divergence: Despite an upswing in the MACD indicator, the price action making lower highs indicates the buyers are not marking a significant impact.
Recent Posts
- Price Analysis
Weekly Crypto Price Prediction: Bitcoin, Ethereum and XRP
Bitcoin, Ethereum, and XRP prices are rallying following a sharp increase in overall market momentum. …
- Price Analysis
MSTR Stock Price Prediction 2026: Wall Street Senior Analyst Targets $500
MSTR stock price has dropped nearly 66% over the past six months, falling from above…
- Price Analysis
XRP Price Reclaims $2 After 10% Breakout: How High Can It Climb in January 2026?
XRP price jumped 10% in the last 24 hours, reclaiming the $2 level as bullish…
- Price Analysis
Ethereum Price Prediction 2026 As Vitalik Buterin Unveils New Scaling Roadmap
Ethereum price as the year 2026 begins has rallied past $3,100, marking a strong recovery.…
- Price Analysis
Bitcoin and XRP Price Prediction 2026 Ahead of US Crypto Reserve, CLARITY Act
Bitcoin price and XRP price enter 2026 trading within compression structures that reflect balance rather…
- Price Analysis
Analyst Predicts Cardano Price to Surge 103% to $0.75 as Midnight, Leios Launch Near
Cardano price started the year well, rising for the initial two days. ADA rose by…