
SHIB Price Prediction: Will Shiba Inu Coin Hold or Fold at $0.000007?


The Shiba Inu coin price in the weekly time frame chart shows a V-top reversal from the $0.00001136 level. The new lower high formed in this reversal suggests the overall trend is negative and could promote further downfall in the near term. Will the falling SHIB price find suitable support at $0.000007?
Also Read: “Burn Portal is in the Works”- Shiba Inu Lead Developer Shytoshi Kusama
Weakening Bearish Momentum Hints Reversal From $0.000007
- The falling SHIB price aligned with decreasing volume suggests the ongoing correction is temporary.
- The coin buyers should experience strong demand pressure at $0.000007
- The intraday trading volume of the Shiba Inu coin is $88 Million, showing a 13% gain.
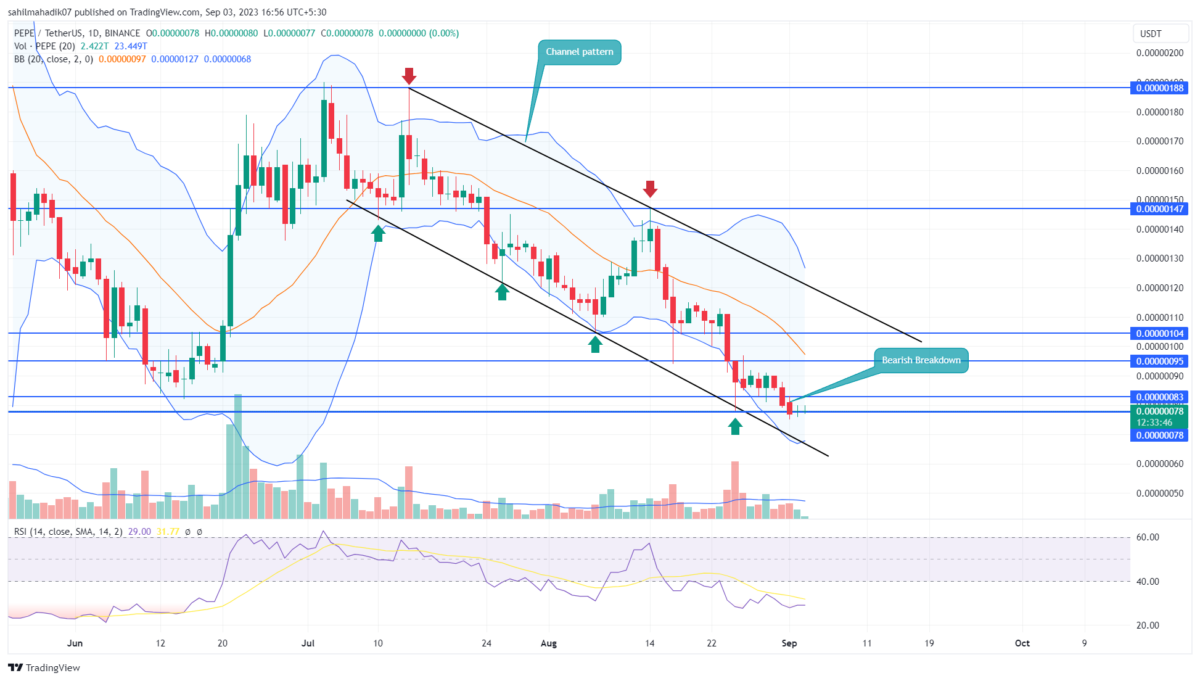
 Source- Tradingview
The SHIB price correction phase showed an aggressive downfall with four consecutive red candles in the weekly time frame chart. From the $0.00001136 peak, this meme coin’s market value dropped nearly 33% to currently trade at $0.00000757.
With the selling pressure active, the Dog-themed memecoin will tumble 7.2% to hit the $0.000007 psychological support. However, this downward projection backed by decreasing volume activity indicates a weakness in bearish momentum.
Moreover, the anticipated fall to $0.0000073 will also obtain additional support from the 78.6% Fibonacci retracement level. The coin holders must closely watch this support as buyers could step in to replenish bullish momentum.
Here’s How SHIB Price Kickstart a New Rally?
While the Shiba Inu price is expected to witness demand pressure at $0.000007 support, the technical chart projects the overall trend as bearish and following the path of a falling wedge pattern. Under the influence of this pattern, the coin price constantly resonates between two converging trendlines. If the coin meme buyers manage to rebound from the aforementioned support, it would still need a breakout from the upper trendline to trigger a new bullish trend.
- Bollinger Band: An uptick in the lower band of the Bollinger Band indicator could offer another layer of support to market buyers.
- Relative Strength Index: The daily RSI slope above 40% accentuates sufficient buying momentum for a price reversal.
Play 10,000+ Casino Games at BC Game with Ease
- Instant Deposits And Withdrawals
- Crypto Casino And Sports Betting
- Exclusive Bonuses And Rewards


Why Trust CoinGape
CoinGape has covered the cryptocurrency industry since 2017, aiming to provide informative insights Read more…to our readers. Our journal analysts bring years of experience in market analysis and blockchain technology to ensure factual accuracy and balanced reporting. By following our Editorial Policy, our writers verify every source, fact-check each story, rely on reputable sources, and attribute quotes and media correctly. We also follow a rigorous Review Methodology when evaluating exchanges and tools. From emerging blockchain projects and coin launches to industry events and technical developments, we cover all facets of the digital asset space with unwavering commitment to timely, relevant information.


- MetaMask Token Launch: MASK Airdrop Now Live for Eligible Wallets
- L2 Unity Launches 50M Token Airdrop Across Arbitrum and Optimism, Eligibility Open for 100K Wallets
- Tom Lee’s Bitmine Adds 5,000 ETH Despite $7.5B Unrealized Loss as BMNR Stock Rebounds
- CLARITY Act Should Ban Stablecoin Yields to Advance in Senate, French Hill Says
- U.S. Set to Deploy Warships to Keep the Strait of Hormuz Open, Bitcoin Climbs
- Official Trump Price Prediction As TRUMP Token Soars 50% Ahead Mar-a-Lago Invite Buzz for Top Holders
- Solana vs XRP Price Forecast: Can SOL Reclaim Its All-Time High Before XRP Hits $2?
- Top Analyst Predicts Cardano Price Could Surge 100% As Bitcoin Breaks $72k
- What’s Keeping Shiba Inu Below $0.0000065- Analyst Predicts 30% Rise Ahead
- Will BTC Price Rally to $100K by 2026? Kalshi and Polymarket Odds Climb to 51%
- Why Pi Network Price Surged 30% Today?


