SHIB Price Prediction: Will Shiba Inu Coin Hold or Fold at $0.000007?

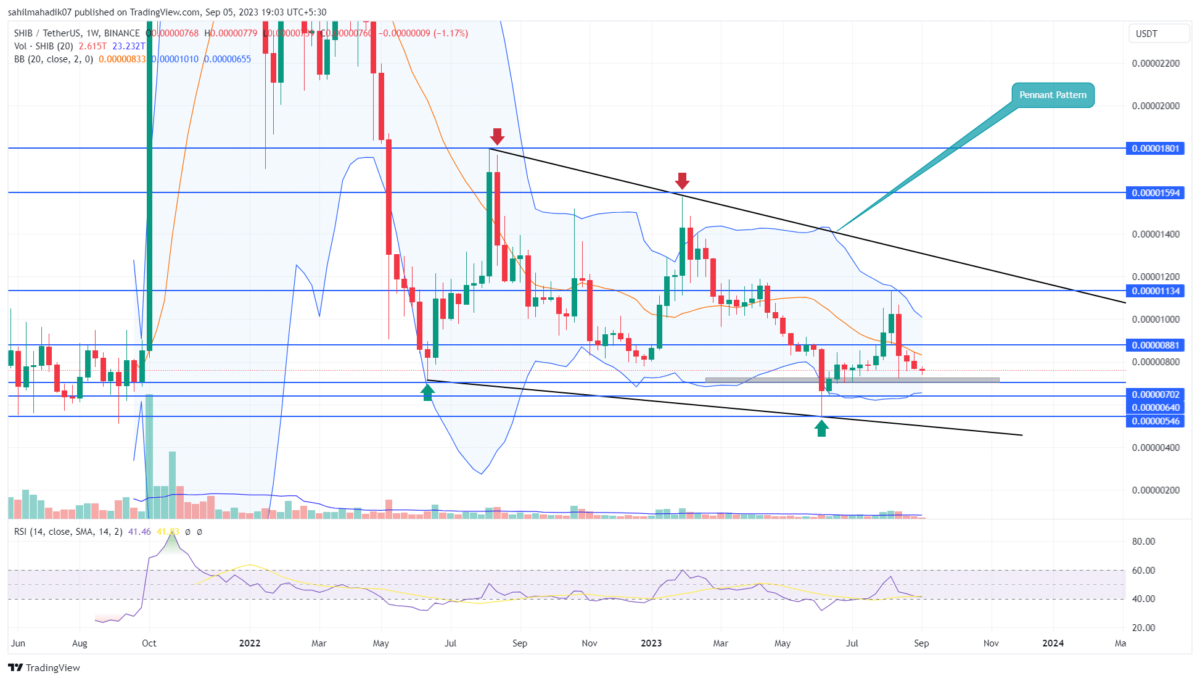
The Shiba Inu coin price in the weekly time frame chart shows a V-top reversal from the $0.00001136 level. The new lower high formed in this reversal suggests the overall trend is negative and could promote further downfall in the near term. Will the falling SHIB price find suitable support at $0.000007?
Also Read: “Burn Portal is in the Works”- Shiba Inu Lead Developer Shytoshi Kusama
Weakening Bearish Momentum Hints Reversal From $0.000007
- The falling SHIB price aligned with decreasing volume suggests the ongoing correction is temporary.
- The coin buyers should experience strong demand pressure at $0.000007
- The intraday trading volume of the Shiba Inu coin is $88 Million, showing a 13% gain.
The SHIB price correction phase showed an aggressive downfall with four consecutive red candles in the weekly time frame chart. From the $0.00001136 peak, this meme coin’s market value dropped nearly 33% to currently trade at $0.00000757.
With the selling pressure active, the Dog-themed memecoin will tumble 7.2% to hit the $0.000007 psychological support. However, this downward projection backed by decreasing volume activity indicates a weakness in bearish momentum.
Moreover, the anticipated fall to $0.0000073 will also obtain additional support from the 78.6% Fibonacci retracement level. The coin holders must closely watch this support as buyers could step in to replenish bullish momentum.
Here’s How SHIB Price Kickstart a New Rally?
While the Shiba Inu price is expected to witness demand pressure at $0.000007 support, the technical chart projects the overall trend as bearish and following the path of a falling wedge pattern. Under the influence of this pattern, the coin price constantly resonates between two converging trendlines. If the coin meme buyers manage to rebound from the aforementioned support, it would still need a breakout from the upper trendline to trigger a new bullish trend.
- Bollinger Band: An uptick in the lower band of the Bollinger Band indicator could offer another layer of support to market buyers.
- Relative Strength Index: The daily RSI slope above 40% accentuates sufficient buying momentum for a price reversal.
Recent Posts
- Price Analysis
Dogecoin Price Prediction Points to $0.20 Rebound as Coinbase Launches Regulated DOGE Futures
Dogecoin price has gone back to the spotlight as it responds to the growing derivatives…
- Price Analysis
Pi Coin Price Prediction as Expert Warns Bitcoin May Hit $70k After BoJ Rate Hike
Pi Coin price rose by 1.05% today, Dec. 18, mirroring the performance of Bitcoin and…
- Price Analysis
Cardano Price Outlook: Will the NIGHT Token Demand Surge Trigger a Rebound?
Cardano price has entered a decisive phase as NIGHT token liquidity rotation intersects with structural…
- Price Analysis
Will Bitcoin Price Crash to $74K as Japan Eyes Rate Hike on December 19?
Bitcoin price continues to weaken after breaking below its recent consolidation range, now trading within…
- Price Analysis
Bitwise Predicts Solana Price Will Hit New All-Time Highs in 2026
Solana price declined by 4% over the past 24 hours, breaking below the key $130…
- Price Analysis
Bitcoin Price Outlook: Capriole Founder Warns of a Drop Below $50K by 2028
Bitcoin price narratives continue to evolve as long-term downside risks regain attention. Bitcoin price discussions…