SHIB Price to Hit $0.00001? Triangle Pattern Points to Major Breakout
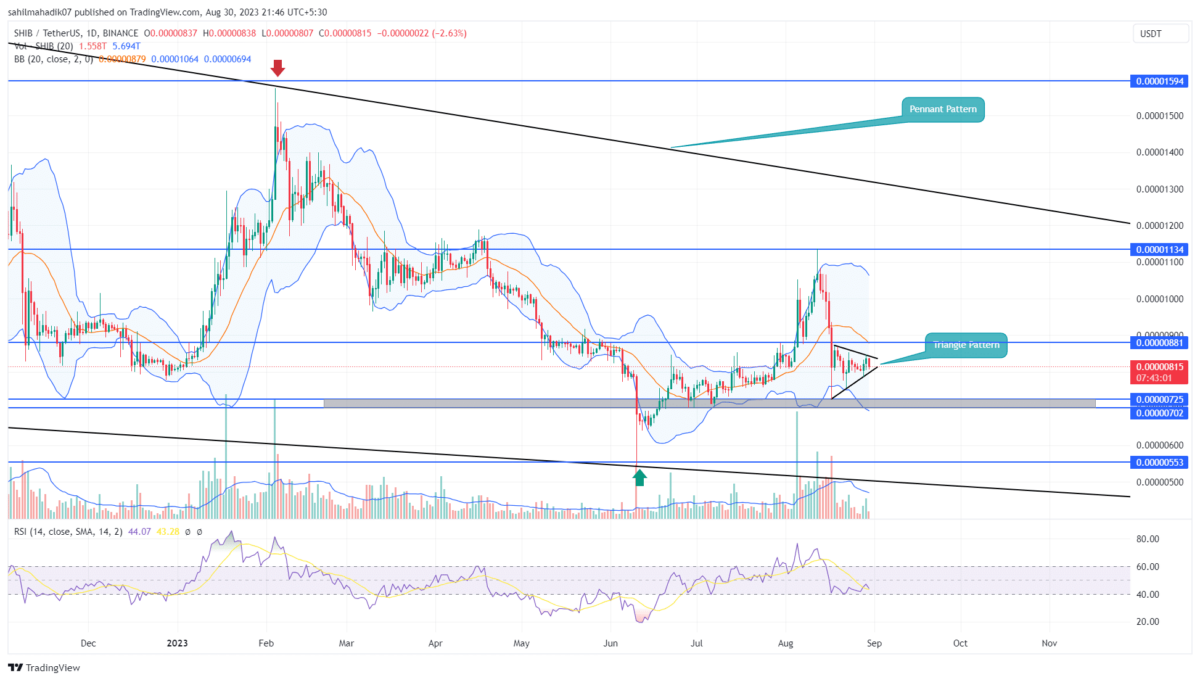
For the past two weeks, the Shiba Inu price has been trading sideways reflecting indecisive sentiment around the crypto space. However, the daily chart indicates this consolidation is confined within two converging trendlines indicating the formation of a symmetrical triangle pattern. With the coin price actively rebounding from the pattern’s converging trendline this setup should have a significant impact on near future trends.
Also Read: Memecoins Like Pepe Coin, DOGE, And Shiba Inu Outpace Stablecoins In Gas Fees
Shiba Inu Daily Chart: Key Points
- Overhead supply could prolong the sideways action in the SHIB price
- SHIB price edging close to the triangle peak hints that a breakout opportunity is near, suggesting a directional move ahead
- The intraday trading volume of the Shiba Inu coin is $175.8 Million, showing a 14% gain.
On August 29th, the crypto market witnessed a significant inflow in response to a sudden pump in Bitcoin price. As a result, this Dog-themed memecoin surged 2.8% and tried to break off its long-coming consolidation.
However, the buyers faced supply pressure near $0.00000845 and plunged back into the triangle pattern. Despite a push from the broader market and increasing volume, the SHIB price failure to surge higher reflects that buyers would need even higher momentum to escape the consolidation trend.
By the press time, the memecoin trades at $0.00000813, and with an intraday loss of 2.7% the price trend prolongs sideways. The potential traders must for this triangle breakout before entering a position in the market.
Can SHIB Price to Regain $0.00001?
While the triangle pattern supper trend continues, the Shib sellers have a higher possibility to break the lower trendline. A 4-hour candle closing below the support trendline will accelerate the selling pressure and push the price back to $0.000007 psychological support.
On a contrary note, an upside breakout from a triangle pattern could assist a price rally above the $0.0000088 barrier to hit $0.0000113.
- Bollinger Band: The lower boundary of the Bollinger Band indicator flattening at $0.000007 could offer additional support to coin buyers.
- Relative Strength Index: The daily RSI slope below the 50% midline indicates the bearish momentum in active.
Recent Posts
- Price Analysis
SUI Price Forecast After Bitwise Filed for SUI ETF With U.S. SEC – Is $3 Next?
SUI price remains positioned at a critical intersection of regulatory positioning and technical structure. Recent…
- Price Analysis
Bitcoin Price Alarming Pattern Points to a Dip to $80k as $2.7b Options Expires Today
Bitcoin price rebounded by 3% today, Dec. 19, reaching a high of $87,960. This rise…
- Price Analysis
Dogecoin Price Prediction Points to $0.20 Rebound as Coinbase Launches Regulated DOGE Futures
Dogecoin price has gone back to the spotlight as it responds to the growing derivatives…
- Price Analysis
Pi Coin Price Prediction as Expert Warns Bitcoin May Hit $70k After BoJ Rate Hike
Pi Coin price rose by 1.05% today, Dec. 18, mirroring the performance of Bitcoin and…
- Price Analysis
Cardano Price Outlook: Will the NIGHT Token Demand Surge Trigger a Rebound?
Cardano price has entered a decisive phase as NIGHT token liquidity rotation intersects with structural…
- Price Analysis
Will Bitcoin Price Crash to $74K as Japan Eyes Rate Hike on December 19?
Bitcoin price continues to weaken after breaking below its recent consolidation range, now trading within…