Shiba Inu Price Analysis: Can $SHIB Price Reclaim $0.000008 By June End?
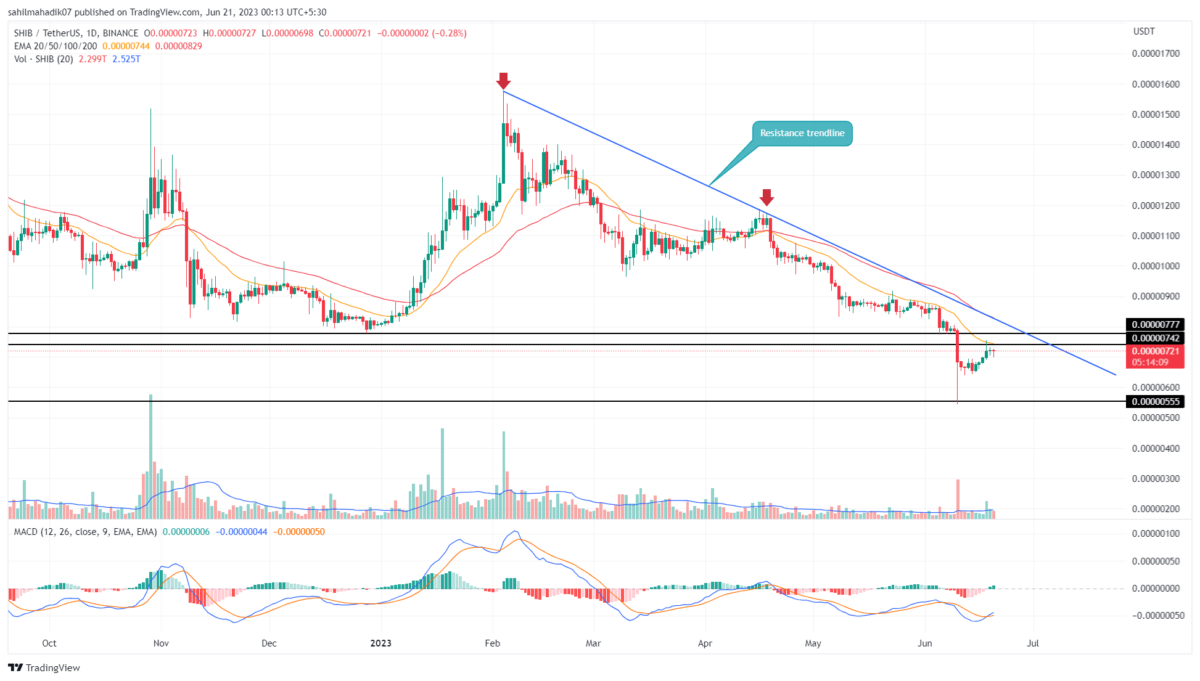
Shiba Inu Price Analysis: On June 10th, the Shiba Inu price witnessed a massive sell-off and reached a low of $0.00000543 to record a 30% loss. However, the buyers made a robust comeback from the $0.00000555 support and recovered half of the day’s loss. The long-wick rejection showcased in the daily chart reflects the intense demand pressure at the aforementioned support. Can this support recuperate the bullish momentum and surge price higher or there’s in the current downtrend?
Also Read: Shiba Inu Burn Rate Soars Over 1000%, Will SHIB Price Explode?
Shiba Inu Price Daily Chart:
- The $0.0000055 stands as a high accumulation zone for buyers
- A breakout above the downsloping trendline is needed to trigger a significant recovery
- The intraday trading volume of the Shiba Inu coin is $94.5 Million, showing a 22% gain.
Amid the recent reflected rally in the crypto market, the Shiba Inu price experienced a significant recovery from mid-June. From the June 15th low of $0.0000065, the memecoin surged 12% to reach the nearest resistance of $0.00000742-$0.00000777.
However, this recovery is more likely triggered by a surge in buying pressure generated by bulls accumulating at discounted prices. Anyhow, a sudden recovery as such is less probable, and therefore, the SHIB price could revert lower to replenish the bullish momentum.
In addition, the coin price shows a higher price rejection at $0.00000742 indicating the overhead supply pressure is still intact.
Will Shiba Inu’s Price Rally to $0.000008?
With the increasing uncertainty in the crypto market, the Shiba Inu price can witness a sideways trend in the coming days. Amid this consolidation, the prices are poised to hit the downsloping resistance trendline. This dynamic resistance is carrying the current downfall in SHIB price and therefore interested traders must wait for its breakout before entering a long position.
- Moving Average Convergence Divergence: A bullish crossover between the MACD(blue) and the signal(orange) line could boast buying momentum and assist buyers to retest the overhead trendline
- Exponential Moving Average: The 20-and-50-day EMAs act as excellent dynamic resistance against buyers
Recent Posts
- Price Analysis
Will Solana Price Hit $150 as Mangocueticals Partners With Cube Group on $100M SOL Treasury?
Solana price remains a focal point as it responds to both institutional alignment and shifting…
- Price Analysis
SUI Price Forecast After Bitwise Filed for SUI ETF With U.S. SEC – Is $3 Next?
SUI price remains positioned at a critical intersection of regulatory positioning and technical structure. Recent…
- Price Analysis
Bitcoin Price Alarming Pattern Points to a Dip to $80k as $2.7b Options Expires Today
Bitcoin price rebounded by 3% today, Dec. 19, reaching a high of $87,960. This rise…
- Price Analysis
Dogecoin Price Prediction Points to $0.20 Rebound as Coinbase Launches Regulated DOGE Futures
Dogecoin price has gone back to the spotlight as it responds to the growing derivatives…
- Price Analysis
Pi Coin Price Prediction as Expert Warns Bitcoin May Hit $70k After BoJ Rate Hike
Pi Coin price rose by 1.05% today, Dec. 18, mirroring the performance of Bitcoin and…
- Price Analysis
Cardano Price Outlook: Will the NIGHT Token Demand Surge Trigger a Rebound?
Cardano price has entered a decisive phase as NIGHT token liquidity rotation intersects with structural…