Shiba Inu Price Analysis: Bullish Pattern Sets $SHIB Price for 17% Upswing
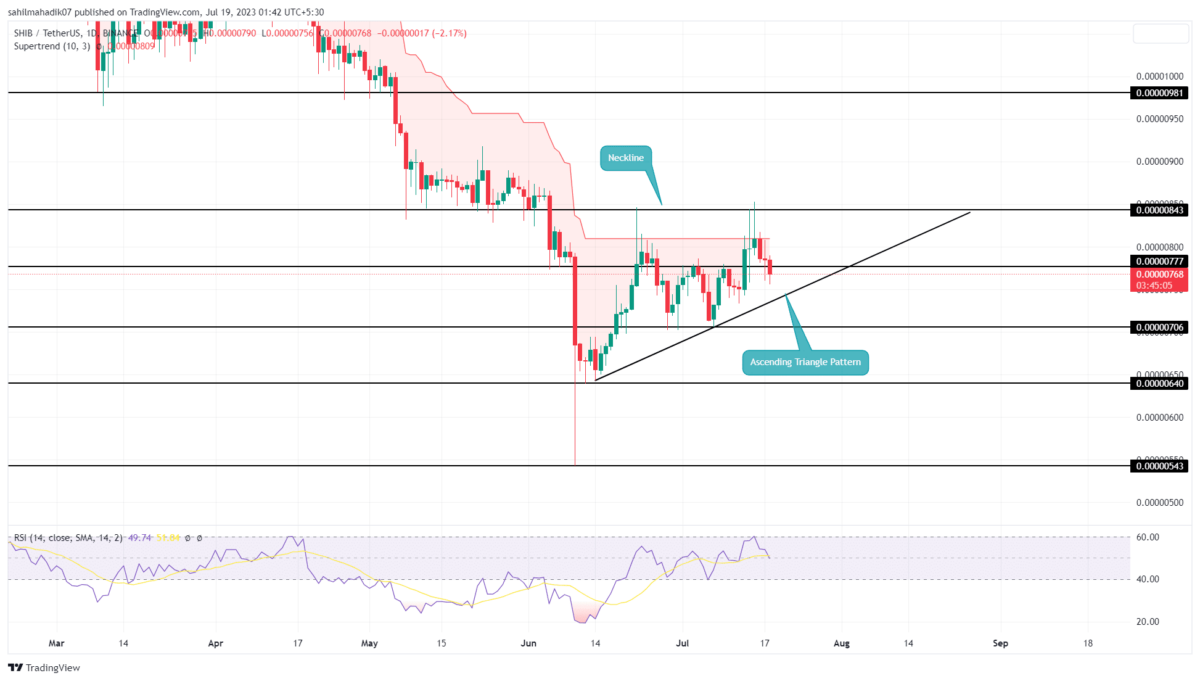
Shiba Inu Price Analysis: An ascending triangle pattern is currently carrying the short-term bull trend in the Shiba Inu price. The bullish continuation pattern is formed using a support trendline and a horizontal neckline resistance. The new higher lows formed using this pattern are a sign of gradual growth in bullish momentum and offer a potential upswing.
Also Read: Shiba Inu Team Denounces LEASH Impersonator
Shiba Inu Price Daily Chart:
- The ongoing recovery in SHIB price may prolong until the triangle pattern is intact.
- A bullish breakout from $0.0000084 will intensify the buying pressure on the market
- The intraday trading volume of the Shiba Inu coin is $83.2 Million, showing a 28% loss.
While the crypto market is wavering in uncertainty, the Shiba Inu price showed another bearish reversal from the $0.0000084 neckline resistance. This reversal tumbled the prices by 9.4% and reached the current trading price of $0.00000769.
However, the falling price may soon reach the lower trendline of the triangle pattern near $0.0000075, offering a pullback opportunity. The dynamic support offering constant support could replenish the bullish momentum and continue the recovery higher.
However, the SHIB price would witness a significant inflow once the bulls breach the $0.0000084 neckline resistance. With a daily candle closing above this barrier, the buyers will obtain a strong launchpad to drive the prices 17% higher and hit $0.0000098
Will SHIB Price Revert to $0.0000083?
If the overall market trend turns bearish, the SHIB price could break the lower trendline as a sign of a major correction. The breached support would turn into a potential resistance assisting sellers to put higher pressure on buyers. The potential downfall could plummet the memecoin back to $0.0000064.
- Relative Strength Index: The formation of higher highs and lows in the daily RSI slope reflects underlying bullish momentum is gradually rising.
- Super Trend: A red film projected in the daily chart indicates the overhead trendline is still bearish.
Recent Posts
- Price Analysis
Bitcoin Price Forecast as BlackRock Sends $125M in BTC to Coinbase — Is a Crash Inevitable?
The Bitcoin price continues to face uncertainty after a recent recovery attempt failed to reclaim…
- Price Analysis
XRP Price Prediction As Spot ETF Inflows Near $1 Billion: What’s Next?
XRP price dropped 5% in the last 24 hours, stabilizing around $2.00 as the market…
- Price Analysis
Solana Price Outlook: Reversal at Key Support Could Lead to $150 Target
Solana price hovered near $135 on Friday, following another unsuccessful attempt to push above $140.…
- Price Analysis
Is Cardano Price at Risk of a 50% Crash Ahead of the Midnight Launch?
In theory, the upcoming Midnight launch should benefit the falling Cardano price. However, technicals suggest…
- Price Analysis
Is Chainlink Price Headed for $20 as Reserves Pass 1M LINK?
The Chainlink price sits at a decisive point this week as reserve growth shifts expectations…
- Price Analysis
Ethereum Price Breaks Out of Falling Wedge: Next Target Now Set at $5K
Ethereum price surged past $3,100 after a brief market consolidation. The cryptocurrency has been on…