Shiba Inu Price Analysis: $SHIB Price Gaze Relief Rally to $0.0000786; Is this a Good Buy?


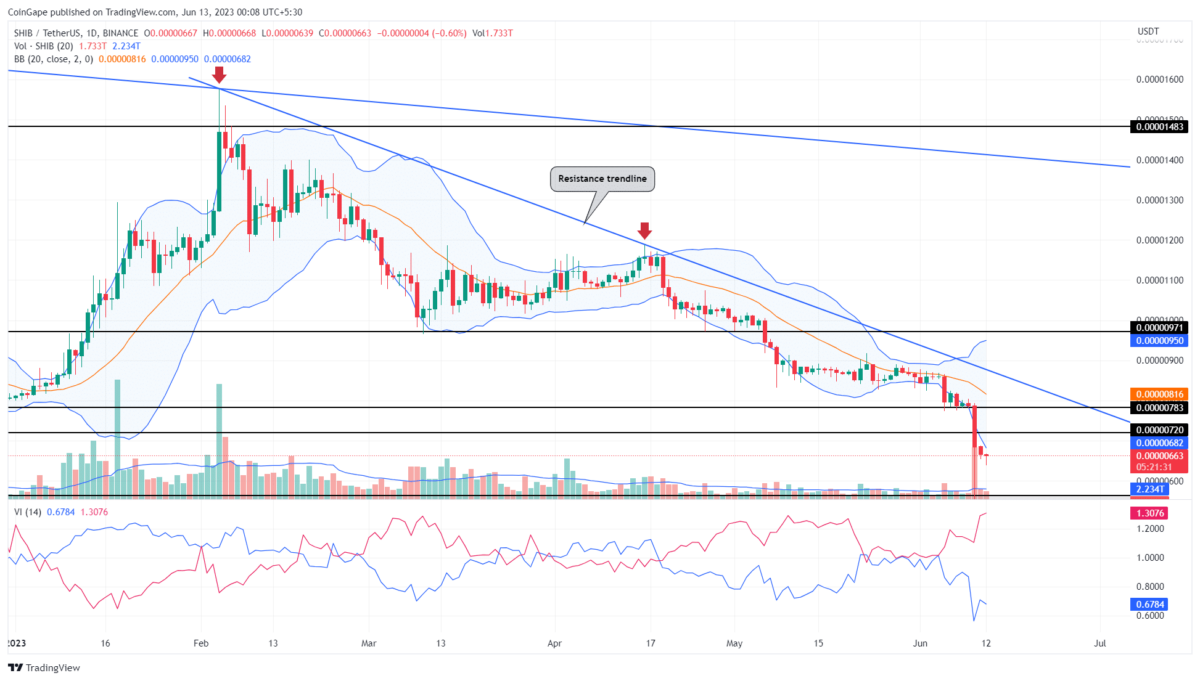
Shiba Inu Price Analysis: Amid last weekend’s altcoin crash, the Shiba Inu coin price witnessed a heavy sell-off and printed a long red candle on June 10th. Amid this downfall, the prices breached crucial support of $0.00000783, and $0.0000072 and reached a two-year low of $0.00000543. Though the support breakdown fueled the overall bearish view for this memecoin, the daily low created at the aforementioned low indicates the SHIB price is likely to go below it.
Also Read- Registered Crypto Exchange Lists Shiba Inu (SHIB) Ecosystem’s BONE Token
Shiba Inu Price Daily Chart:
- The long-tail rejection at $0.0000056 support suggests the buyers are actively defending this level0
- A potential upswing in the SHIB price could raise a temporary recovery of 20%
- The intraday trading volume of the Shiba Inu coin is $120.5 Million, showing a 68% loss.
 Source- Tradingview
On June 10th, the aggressive selling was swiftly countered by buyers, who managed to recover the losses incurred during the day. The resulting long-tail rejection indicated that the buyers are aggressively accumulating at this discounted price and projected a suitable level to revert the price higher.
By the press time, the SHIB coin traded at $0.00000665 and showed another long-tail rejection candle indicating the buying pressure persists. If the bullish momentum rises further, the coin price will witness a minor relief rally to retest the breached support of $0.0000072, and $0.00000783 as potential resistance.
With the higher possibility of sellers defending two resistances, the Shiba price is likely to stay in a downtrend or consolidation phase for the remaining days of June.
Will Shiba Inu’s Price Recover to $0.000008?
On the upside side, the Shiba Inu coin shows a downsloping trendline which has been carrying a steady downtrend for the past four months. Even if the coin price shows a significant recovery in the coming days, the buyers will get a better conviction for long-term recovery if the prices breach the overhead trendline. A breakout above the overhead trendline will boast the buying momentum and surpass $0.000008.
- Vortex Indicator: The wide gap showcased as the VI- slope moves up above the V+ reflects an established downtrend.
- Bollinger Band: The BB indicator challenged on the downside is another sign of intense selling pressure which is unstable and may lead to a swift rebound in the near future

Why Trust CoinGape
CoinGape has covered the cryptocurrency industry since 2017, aiming to provide informative insights Read more…to our readers. Our journal analysts bring years of experience in market analysis and blockchain technology to ensure factual accuracy and balanced reporting. By following our Editorial Policy, our writers verify every source, fact-check each story, rely on reputable sources, and attribute quotes and media correctly. We also follow a rigorous Review Methodology when evaluating exchanges and tools. From emerging blockchain projects and coin launches to industry events and technical developments, we cover all facets of the digital asset space with unwavering commitment to timely, relevant information.
Related Articles


- China Tightens Stablecoin Rules as Bessent Urges Congress to Pass CLARITY Act to Keep Crypto Lead
- Bitget Launches ‘Fan Club’ Initiative In Bid To Strengthen Community Amid Crypto Crash
- BlackRock Signals More Selling as $291M in BTC, ETH Hit Coinbase Amid $2.5B Crypto Options Expiry
- Is Pi Coin Set for Kraken Listing? U.S. Exchange Adds Pi Network to 2026 Roadmap
- Top 5 Reasons Why BTC Price Is Crashing Non-Stop Right Now
- Solana Price at Risk of Crashing Below $50 as Crypto Fear and Greed Index Plunges to 5
- Pi Network Price Prediction Ahead of PI KYC Validator Reward System Launch
- XRP Price Outlook As Peter Brandt Predicts BTC Price Might Crash to $42k
- Will Cardano Price Rise After CME ADA Futures Launch on Feb 9?
- Dogecoin, Shiba Inu, and Pepe Coin Price Prediction as Bitcoin Crashes Below $70K.
- BTC and XRP Price Prediction As Treasury Secretary Bessent Warns “US Won’t Bail Out Bitcoin”


