Shiba Inu Price Analysis: $SHIB Price Gaze Relief Rally to $0.0000786; Is this a Good Buy?

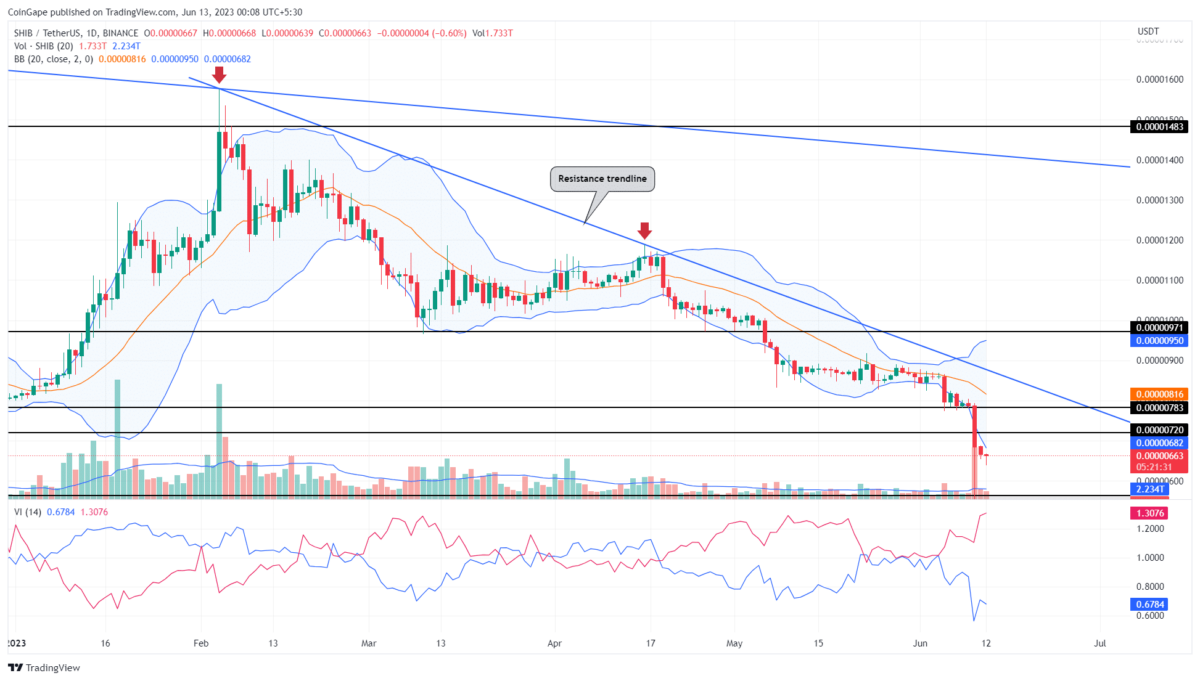
Shiba Inu Price Analysis: Amid last weekend’s altcoin crash, the Shiba Inu coin price witnessed a heavy sell-off and printed a long red candle on June 10th. Amid this downfall, the prices breached crucial support of $0.00000783, and $0.0000072 and reached a two-year low of $0.00000543. Though the support breakdown fueled the overall bearish view for this memecoin, the daily low created at the aforementioned low indicates the SHIB price is likely to go below it.
Also Read- Registered Crypto Exchange Lists Shiba Inu (SHIB) Ecosystem’s BONE Token
Shiba Inu Price Daily Chart:
- The long-tail rejection at $0.0000056 support suggests the buyers are actively defending this level0
- A potential upswing in the SHIB price could raise a temporary recovery of 20%
- The intraday trading volume of the Shiba Inu coin is $120.5 Million, showing a 68% loss.
On June 10th, the aggressive selling was swiftly countered by buyers, who managed to recover the losses incurred during the day. The resulting long-tail rejection indicated that the buyers are aggressively accumulating at this discounted price and projected a suitable level to revert the price higher.
By the press time, the SHIB coin traded at $0.00000665 and showed another long-tail rejection candle indicating the buying pressure persists. If the bullish momentum rises further, the coin price will witness a minor relief rally to retest the breached support of $0.0000072, and $0.00000783 as potential resistance.
With the higher possibility of sellers defending two resistances, the Shiba price is likely to stay in a downtrend or consolidation phase for the remaining days of June.
Will Shiba Inu’s Price Recover to $0.000008?
On the upside side, the Shiba Inu coin shows a downsloping trendline which has been carrying a steady downtrend for the past four months. Even if the coin price shows a significant recovery in the coming days, the buyers will get a better conviction for long-term recovery if the prices breach the overhead trendline. A breakout above the overhead trendline will boast the buying momentum and surpass $0.000008.
- Vortex Indicator: The wide gap showcased as the VI- slope moves up above the V+ reflects an established downtrend.
- Bollinger Band: The BB indicator challenged on the downside is another sign of intense selling pressure which is unstable and may lead to a swift rebound in the near future
Recent Posts
- Price Analysis
Why Bitcoin, Ethereum And XRP Prices Are Down Today? (24 Dec)
The crypto market extended losses ahead of Christmas as Bitcoin, Ethereum, and XRP slipped further…
- Price Analysis
XRP Price Prediction: Will 4 Billion Transactions Spark Next Rally?
XRP price trades below the $2 mark after the latest correction across the broader cryptocurrency…
- Price Analysis
Solana Price Outlook: Will SOL Recover With Strong Institutional Buying?
Solana price remains steady above the $120 support after the recent crypto market pullback. The…
- Price Analysis
Ethereum Price Risks Crash to $2,500 Amid Sustained Wintermute Dumping
Ethereum price dropped below the key support at $3,000 on Tuesday, down by ~40% from…
- Price Analysis
Is It Time to Sell Bitcoin for Gold- Analyst Spots 2023 Pattern That Triggered BTC’s Last Major Rally
The Stock Market rose modestly as crypto market consolidation sparked a fresh Bitcoin vs Gold…
- Price Analysis
Bitcoin Price Prediction and Analysis: Will BTC Hit $100k Before Year-End?
Bitcoin price moves into the final trading sessions with uncertainty around upside continuation. BTC price…