Shiba Inu Price Analysis: What’s Ahead for SHIB Price after Reclaiming $0.000008?
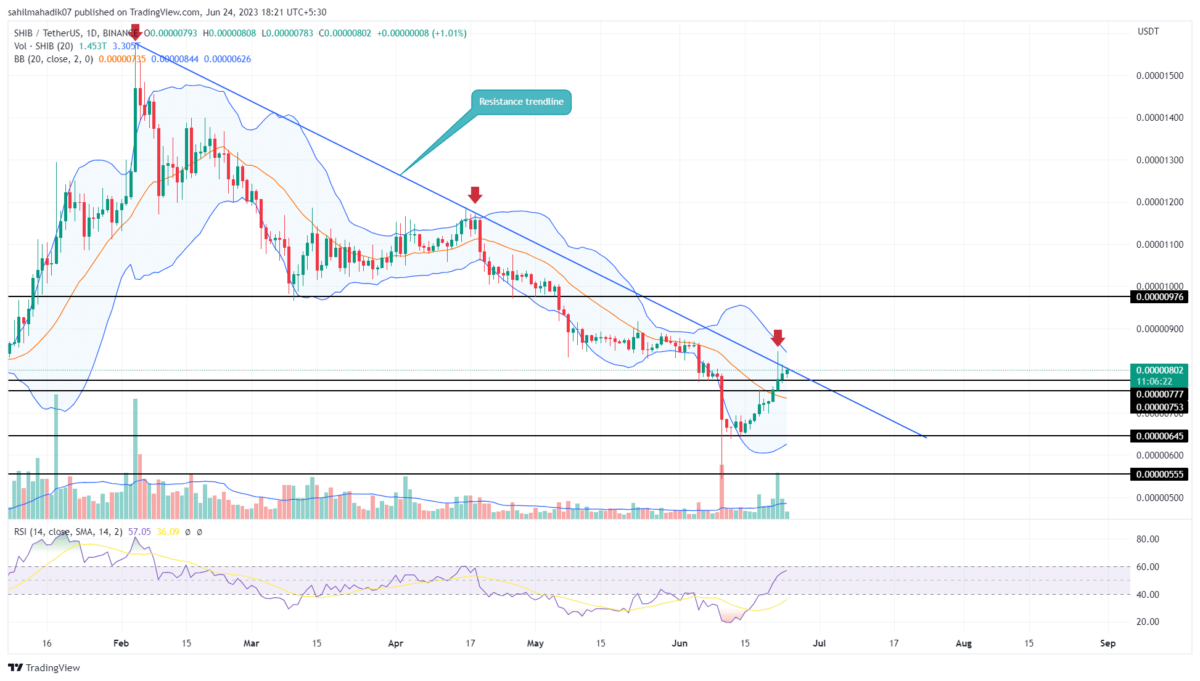
SHIB Price Analysis: The Shiba Inu price received a massive boast amid the recent recovery in market leaders Bitcoin and Ethereum. This memecoin has been rising for ten consecutive days and recorded 23.55% growth as prices jumped from $0.00000645 support to the current price of $0.00000797. The bullish rally backed by increasing volume reflects the strong conviction from traders to rise higher. Can SHIB price prolong this bullish momentum, or there’s an upcoming correction wave waiting?
Also Read: Shiba Inu Burn Rate Spikes 7000%, $SHIB Price Gains And New Updates
Shiba Inu Price Daily Chart:
- The Shiba Inu price could witness high support pressure at a downsloping resistance trendline
- A breakdown below $0.0000075 could plunge the coin price by 7%
- The intraday trading volume of the Shiba Inu coin is $146.2 Million, showing a 16% gain.
With the recent upswing in the daily chart, the Shiba Inu price reclaims the long-coming resistance trendline. The dynamic resistance is the current representation of the ongoing downtrend in the memecoin and therefore stands as an important pivotal point for traders.
On June 22nd, the daily chart showed a long-wick rejection from the downsloping trendline indicating the sellers are still active at this resistance. In case the coin price continues to show supply pressure in the coming days, the SHIB price will likely challenge the $0.0000075 immediate support to induce further downfall.
A breakdown below $0.0000075 support will increase the selling pressure and could tumble the prices back to $0.000007.
Will Shiba Inu’s Price Rally to $0.00001?
For Shiba Price to initiate a sustained recovery rally, the buyers need to give a bullish breakout from the overhead resistance trendline. This breakout could signal an early sign of trend reversal and offer traders an opportunity to go long. This post-breakout rally could drive the price 21% higher and reach the $0.00001 psychological barrier.
- Relative Strength Index: The RSI slope breakout above 60% would reflect high momentum buying among market participants.
- Bollinger Band: An upper band of the Bollinger Band indicator could provide an additional barrier against buyers and bolster a potential downfall.
Recent Posts
- Price Analysis
Will Solana Price Hit $150 as Mangocueticals Partners With Cube Group on $100M SOL Treasury?
Solana price remains a focal point as it responds to both institutional alignment and shifting…
- Price Analysis
SUI Price Forecast After Bitwise Filed for SUI ETF With U.S. SEC – Is $3 Next?
SUI price remains positioned at a critical intersection of regulatory positioning and technical structure. Recent…
- Price Analysis
Bitcoin Price Alarming Pattern Points to a Dip to $80k as $2.7b Options Expires Today
Bitcoin price rebounded by 3% today, Dec. 19, reaching a high of $87,960. This rise…
- Price Analysis
Dogecoin Price Prediction Points to $0.20 Rebound as Coinbase Launches Regulated DOGE Futures
Dogecoin price has gone back to the spotlight as it responds to the growing derivatives…
- Price Analysis
Pi Coin Price Prediction as Expert Warns Bitcoin May Hit $70k After BoJ Rate Hike
Pi Coin price rose by 1.05% today, Dec. 18, mirroring the performance of Bitcoin and…
- Price Analysis
Cardano Price Outlook: Will the NIGHT Token Demand Surge Trigger a Rebound?
Cardano price has entered a decisive phase as NIGHT token liquidity rotation intersects with structural…