Shiba Inu Price Analysis: Will $0.000009 Support Hold Amidst Rising FUD?
SHIB Price Analysis: On August 5th, the Shiba Inu price provided a bullish breakout from the rising wedge pattern. The coin price breaking above the resistance of the chart setup that is following an ascending trend indicates the strong bullish momentum in the market. Will this breakout assist the SHIB price to reclaim $0.00001?
Also Read: Shiba Inu (SHIB) Burn Rate Jumps 100%, Here’s Price Reaction
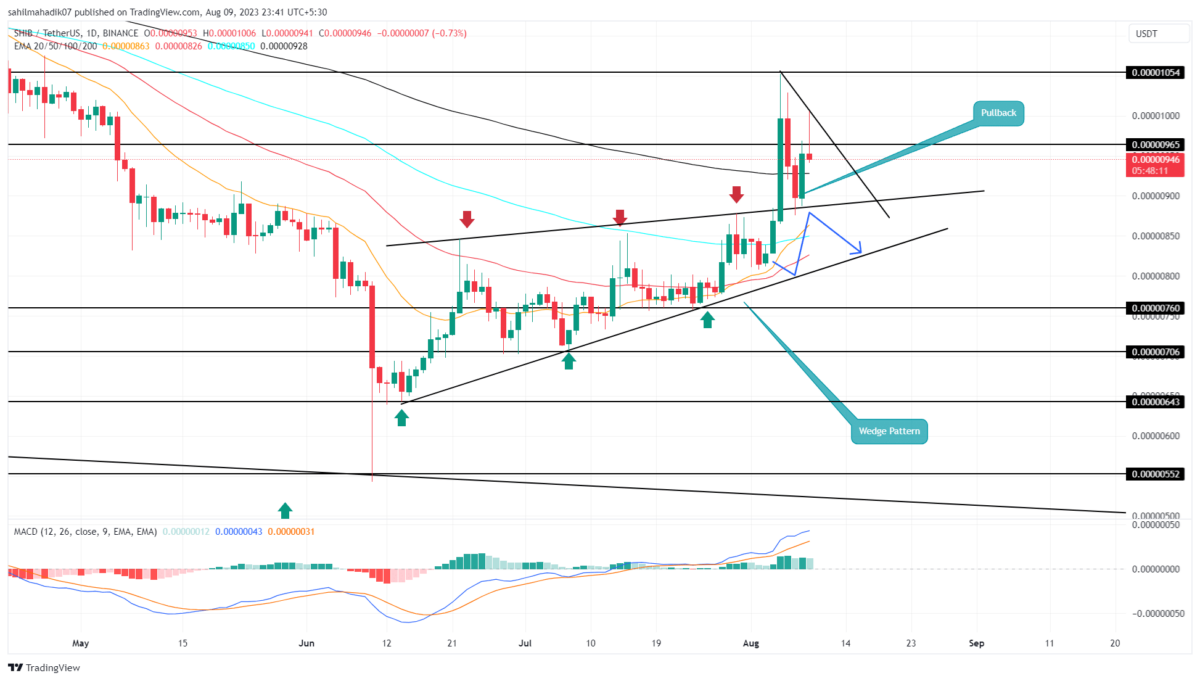
Shiba Inu Price Daily Chart:
- Overhead supply hints the SHIB could retrace 5% to retest the flipped support trendline.
- The coin buyers’ sustainability above $0.000009 could encourage the price to reclaim the $0.00001 milestone
- The intraday trading volume of the Shiba Inu coin is $388.2 Million, showing a 38% gain.
After the massive breakout of the wedge, the Shiba Inu price showed a two-day retest and checked price sustainability at higher levels. On August 7th, the coin price showed a bullish engulfing candle in the daily chart, indicating the accumulation of buyers at their new support.
However, the follow up candle today was expected to provide additional confirmation to the price rally, showing long-wick rejection. This overhead supply suggests the prices could retrace lower and replenish sufficient bullish momentum.
Amid the anticipated pullback, the SHIB holders can still maintain a bullish outlook, if the price shows sustainability above the August 7th mid-point($0.00000923) or breached the resistance trendline.
Can SHIB Price Revisit $0.000012?
While the overall trend remains bullish, the Shiba Inu buyers should manage to hold the above-filled trendline. With sustained buying, the coin price should rise 10% to hit the nearest resistance of $0.0000105, followed by $0.000012.
- Bollinger Band: An inverted hammer candle at the upper ceiling of the Bollinger Band indicates a higher possibility for a pullback.
- Moving Average Convergence Divergence: A bullish crossover state between the MACD(blue) and the signal(orange) line indicates the overall trend as bullish.
Recent Posts
- Price Analysis
Shiba Inu Price Eyes a 45% Rebound as Burn Rate Spikes 10,700%
Shiba Inu price continued its freefall and is now hovering at its lowest level since…
- Price Analysis
Expert Predicts Ethereum Price Rebound to $4k as BitMine, Long-Term Holders Buy
Ethereum price rose by 1.5% today and moved slightly above the important resistance level at…
- Price Analysis
Bitcoin Price Prediction Ahead of FOMC Minutes
Bitcoin price continues trading within a tightening range, with BTC price holding between $88,000 and…
- Price Analysis
U.S. Government Shutdown Looms: These 3 Crypto Predictions Could Explode
As the January trading session unfolds, the crypto market rose 1.07% in 24 hours, showing…
- Price Analysis
Grayscale Files for First U.S. Bittensor ETF: Will TAO Price Rally to $300 in January?
Bittensor (TAO) price climbed above $220 in the last 24 hours after Grayscale filed for…
- Price Analysis
Shiba Inu Price Prediction: Will SHIB Show Golden Cross Signal in 2026?
Discussion around a potential Golden Cross in 2026 has intensified as Shina Inu price compresses…