Shiba Inu Price Analysis: Will $SHIB Price Revert from $0.0000083 or Soar to New Heights?
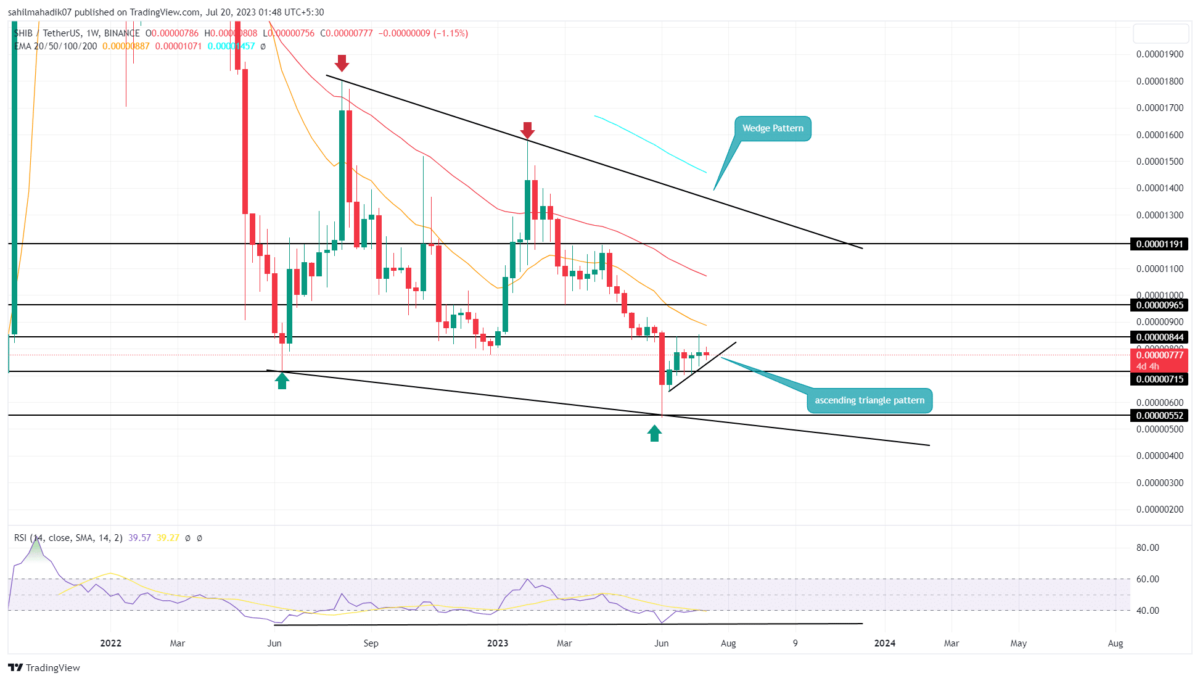
Shiba Inu Price Analysis: In the weekly time frame chart, the Shiba Inu price shows the formation of a falling wedge pattern. Under the influence of this pattern, the coin price coverage within two downsloping trendlines suggesting the downward trend is reaching maturity. However, as of now, the coin price has recently bounced back from the lower support trendline indicating a bullish reversal within the pattern’s range.
Also Read: Shiba Inu Team Denounces LEASH Impersonator
Shiba Inu Price Daily Chart:
- An ascending triangle pattern carries the current recovery phase in SHIB price.
- A bullish breakout from $0.00000845 will set the memecoin for a bullish upswing to $0.00000965
- The intraday trading volume of the Shiba Inu coin is $89.2 Million, showing a 6.53% gain.
After the early June sell-off, the Shiba Inu price rebounded from the support trendline of the wedge pattern. The bullish reversal triggered a bull cycle with the pattern and ideally set a rally back to the overhead trendline.
The fresh rally surged the popular memecoin by 55% and reached the $0.00000845 barrier. Amid the current uncertainty, in the crypto market, the buyers are struggling to break this resistance and create a short consolidation below.
However, this consolidation shaped into an ascending triangle pattern in the daily time frame chart, indicating the SHIB price is witnessing gradual accumulation from buyers. In response to this pattern, the memecoin could break the $0.00000845 as a signal to uptrend continuation.
What if SHIB Price Breaks $0.00000845 Barrier?
If the overhead supply at $0.00000845 resistance persists, the Shiba Inu price may prolong the sideways trend for a few more trading days. However, the converging range of the ascending triangle pattern will eventually lead to a breakout move, with more probability of surpassing $0.00000845. This breakout could offer potential buyers an opportunity and lead the price rally to $0.00000965, followed by $0.0000119.
- Relative Strength Index: Despite a lower low formation in SHIB price, the daily RSI slope forming the same low indicates the increased accumulation from buyers and therefore potential for recovery.
- Exponential Moving Average: The SHIB price below the 100 EMA of the weekly chart indicates the long-term trend is bearish.
Recent Posts
- Price Analysis
Bitcoin Price Prediction As Michael Saylor Pauses BTC Purchase- Is A Fall to $74k Imminent?
Michael Saylor's Strategy has paused additional BTC purchases while increasing cash reserves, prompting renewed speculation…
- Price Analysis
Aster launched Phase 5 Buyback Program Allocating 80% Fees. Will ASTER Price Rally?
Aster price hovered above $0.70 following a 2.67% daily gain, supported by a bullish market…
- Price Analysis
XRP Price Prediction: Rare Bullish Patterns Align With Powerful Catalysts
The XRP price has stabilized in the past few days as it jumped by ~9%…
- Price Analysis
Weekly Crypto Price Prediction: Bitcoin, Ethereum, and XRP as Market Momentum Builds
As Christmas week begins, the crypto market shows early signs of recovery. Over the past…
- Price Analysis
Will Solana Price Hit $150 as Mangocueticals Partners With Cube Group on $100M SOL Treasury?
Solana price remains a focal point as it responds to both institutional alignment and shifting…
- Price Analysis
SUI Price Forecast After Bitwise Filed for SUI ETF With U.S. SEC – Is $3 Next?
SUI price remains positioned at a critical intersection of regulatory positioning and technical structure. Recent…