Shiba Inu Price Analysis: Will $SHIB Price Surpass $0.00001 in August?


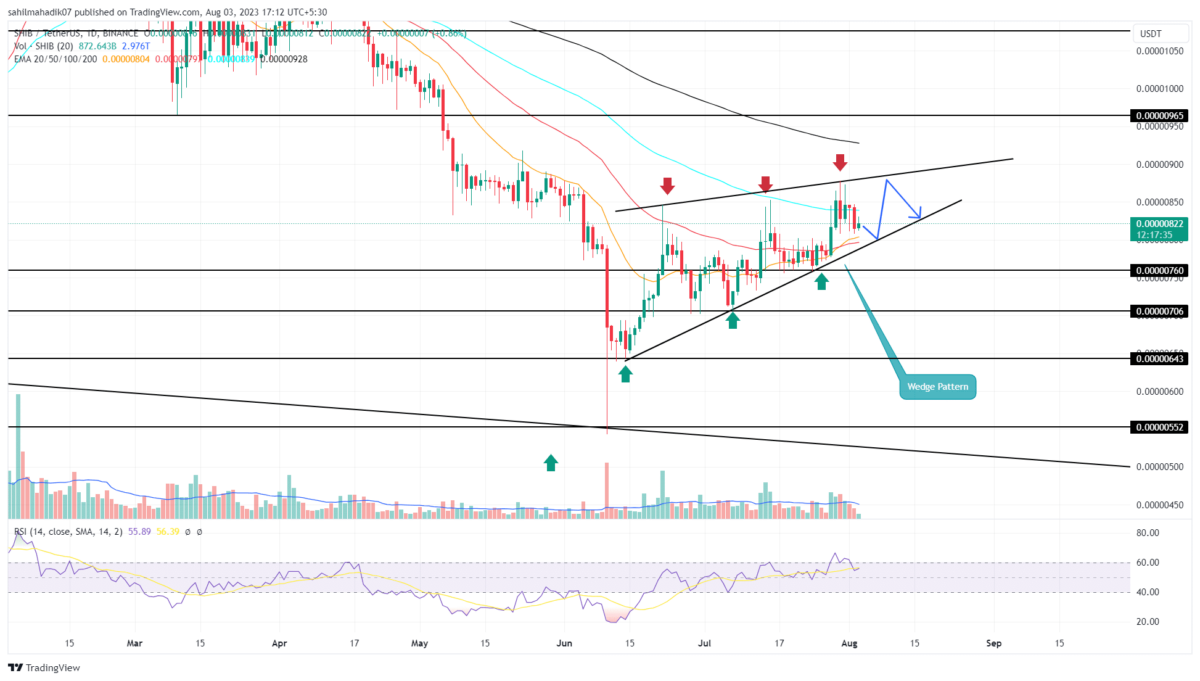
Shiba Inu Price Analysis: The two-month recovery in Shiba Inu price has shaped into a bearish setup pattern called a rising wedge. The pattern is characterized by two converging trendlines which provide a temporary halt in an established downtrend. Under the influence of this pattern, the SHIB price is at risk of major correction which could lead to prices below $0.000008. Should you sell on this?
Also Read: Shibarium Anticipation Climbs As $28M Worth of Shiba Inu Tokens Exit Exchanges
Shiba Inu Price Daily Chart:
- The Shiba Inu price may extend its steady recovery until the wedge pattern is intact.
- A bearish breakdown from the pattern’s support trendline could set this memecoin for a 12-20% fall
- The intraday trading volume of the Shiba Inu coin is $127.2 Million, showing a 13% gain.
 Source- Tradingview
Within the last two months, the Shiba Inu price has rebounded twice from the pattern’s upper trendline and thrice from the lower trendline, indicating it has a significant influence on market participants. With each bounced back from the trendlines, the range between the wedge pattern gets narrow indicating the prices will eventually give a breakout opportunity.
On July 30th, the coin price witnessed its latest reversal from the overhead trendline, leading 6% drop and reach the current trading price of $0.00000825. If the bearish momentum persists, the coin price could plummet another 3% to challenge the bottom support trendline.
With a higher possibility, the SHIB price is likely to break the lower trendline as a signal for downtrend continuation. The post-breakdown rally would tumble the memecoin 12% and reach the $0.000007 psychological level.
Can SHIB Price Reclaim $0.0001?
While in theory, the rising wedge pattern is a downtrend continuation pattern, on rare occasions where the bullish momentum is high, the coin price could poke the upper trendline. A bullish breakout from a bearish pattern is a strong buy signal. Therefore, the resistance trendline breakout with candle closing could accelerate the buying pressure and would likely surge the SHIB price above $0.00001
- Relative Strength Index: The price action and daily RSI slope rising with similar momentum indicate a sustained recovery which could last a few more days or weeks.
- Exponential Moving Average: The Shiba Inu price trading below the 200-day EMA indicates the long-term trend is still bearish.


- Do Kwon Faces Up to 12 Years in Prison Over ‘Colossal’ Role in $40B TerraUSD Collaps
- ProShares Drops 3x Bitcoin, Ethereum, XRP ETF Plans After SEC Pushback
- Bitcoin Eyes Fresh Demand as Indiana Advances Bill for Crypto Investments
- Crypto Bill Markup Unlikely This Month Amid DeFi, Stablecoin Yield and Conflict Disputes, Expert Says
- Breaking: U.S. PCE Inflation Rises To 2.8%, Bitcoin Falls
- XRP Price Prediction As Spot ETF Inflows Near $1 Billion: What’s Next?
- Solana Price Outlook: Reversal at Key Support Could Lead to $150 Target
- Is Cardano Price at Risk of a 50% Crash Ahead of the Midnight Launch?
- Is Chainlink Price Headed for $20 as Reserves Pass 1M LINK?
- Ethereum Price Breaks Out of Falling Wedge: Next Target Now Set at $5K
- Is ZCash Price Set for a Bigger Rally After Its 10% Surge on the Bitget Listing?


Why Trust CoinGape
CoinGape has covered the cryptocurrency industry since 2017, aiming to provide informative insights Read more…to our readers. Our journal analysts bring years of experience in market analysis and blockchain technology to ensure factual accuracy and balanced reporting. By following our Editorial Policy, our writers verify every source, fact-check each story, rely on reputable sources, and attribute quotes and media correctly. We also follow a rigorous Review Methodology when evaluating exchanges and tools. From emerging blockchain projects and coin launches to industry events and technical developments, we cover all facets of the digital asset space with unwavering commitment to timely, relevant information.
Premium Partners


