Shiba Inu Price Analysis: Will $SHIB Price Surpass $0.00001 in August?
Shiba Inu Price Analysis: The two-month recovery in Shiba Inu price has shaped into a bearish setup pattern called a rising wedge. The pattern is characterized by two converging trendlines which provide a temporary halt in an established downtrend. Under the influence of this pattern, the SHIB price is at risk of major correction which could lead to prices below $0.000008. Should you sell on this?
Also Read: Shibarium Anticipation Climbs As $28M Worth of Shiba Inu Tokens Exit Exchanges
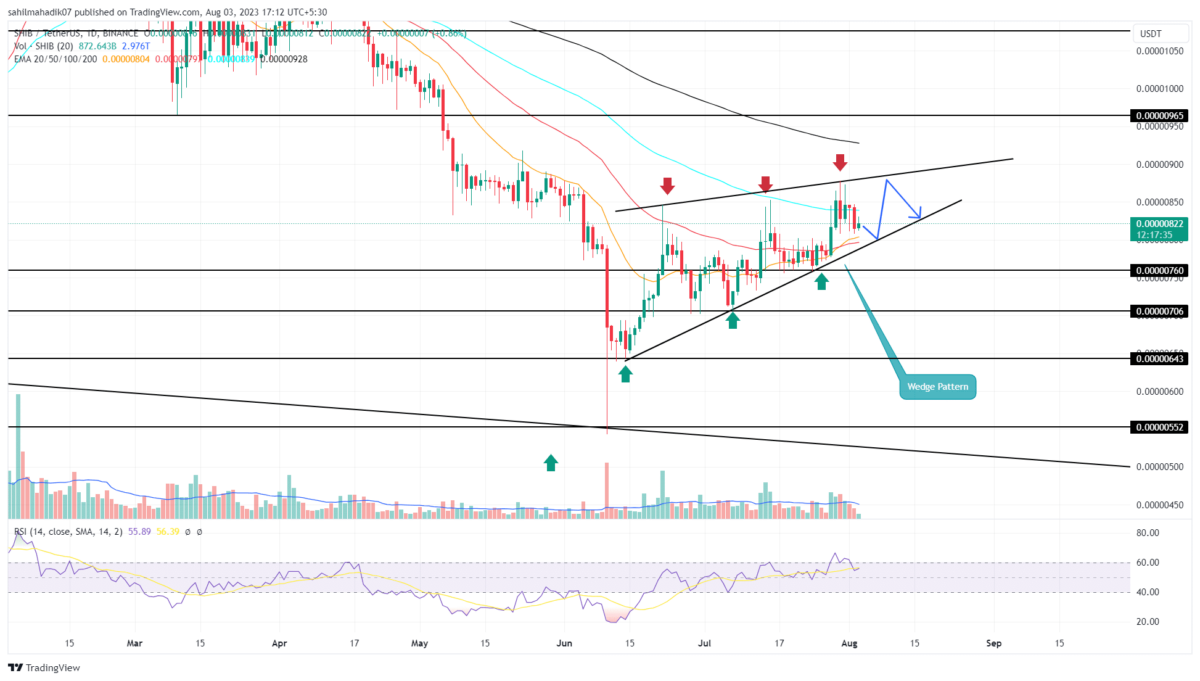
Shiba Inu Price Daily Chart:
- The Shiba Inu price may extend its steady recovery until the wedge pattern is intact.
- A bearish breakdown from the pattern’s support trendline could set this memecoin for a 12-20% fall
- The intraday trading volume of the Shiba Inu coin is $127.2 Million, showing a 13% gain.
Within the last two months, the Shiba Inu price has rebounded twice from the pattern’s upper trendline and thrice from the lower trendline, indicating it has a significant influence on market participants. With each bounced back from the trendlines, the range between the wedge pattern gets narrow indicating the prices will eventually give a breakout opportunity.
On July 30th, the coin price witnessed its latest reversal from the overhead trendline, leading 6% drop and reach the current trading price of $0.00000825. If the bearish momentum persists, the coin price could plummet another 3% to challenge the bottom support trendline.
With a higher possibility, the SHIB price is likely to break the lower trendline as a signal for downtrend continuation. The post-breakdown rally would tumble the memecoin 12% and reach the $0.000007 psychological level.
Can SHIB Price Reclaim $0.0001?
While in theory, the rising wedge pattern is a downtrend continuation pattern, on rare occasions where the bullish momentum is high, the coin price could poke the upper trendline. A bullish breakout from a bearish pattern is a strong buy signal. Therefore, the resistance trendline breakout with candle closing could accelerate the buying pressure and would likely surge the SHIB price above $0.00001
- Relative Strength Index: The price action and daily RSI slope rising with similar momentum indicate a sustained recovery which could last a few more days or weeks.
- Exponential Moving Average: The Shiba Inu price trading below the 200-day EMA indicates the long-term trend is still bearish.
Recent Posts
- Price Analysis
Bitcoin Price Forecast as BlackRock Sends $125M in BTC to Coinbase — Is a Crash Inevitable?
The Bitcoin price continues to face uncertainty after a recent recovery attempt failed to reclaim…
- Price Analysis
XRP Price Prediction As Spot ETF Inflows Near $1 Billion: What’s Next?
XRP price dropped 5% in the last 24 hours, stabilizing around $2.00 as the market…
- Price Analysis
Solana Price Outlook: Reversal at Key Support Could Lead to $150 Target
Solana price hovered near $135 on Friday, following another unsuccessful attempt to push above $140.…
- Price Analysis
Is Cardano Price at Risk of a 50% Crash Ahead of the Midnight Launch?
In theory, the upcoming Midnight launch should benefit the falling Cardano price. However, technicals suggest…
- Price Analysis
Is Chainlink Price Headed for $20 as Reserves Pass 1M LINK?
The Chainlink price sits at a decisive point this week as reserve growth shifts expectations…
- Price Analysis
Ethereum Price Breaks Out of Falling Wedge: Next Target Now Set at $5K
Ethereum price surged past $3,100 after a brief market consolidation. The cryptocurrency has been on…