Shiba Inu Price Hints Last Pullback Before a Rally Above $0.00001
Despite the increasing FUD in the crypto market, the Shiba Inu price showed a significant recovery in early August. This recent bullish swing formed a breakout from the resistance trendline of the rising wedge pattern. An upside breakout of this pattern is rare and signals a strong buying signal for traders. Is this setup enough to invest in SHIB?
Also Read: New Whale Scoops 4 Trillion Shiba Inu (SHIB) Ahead Of Shibarium Launch
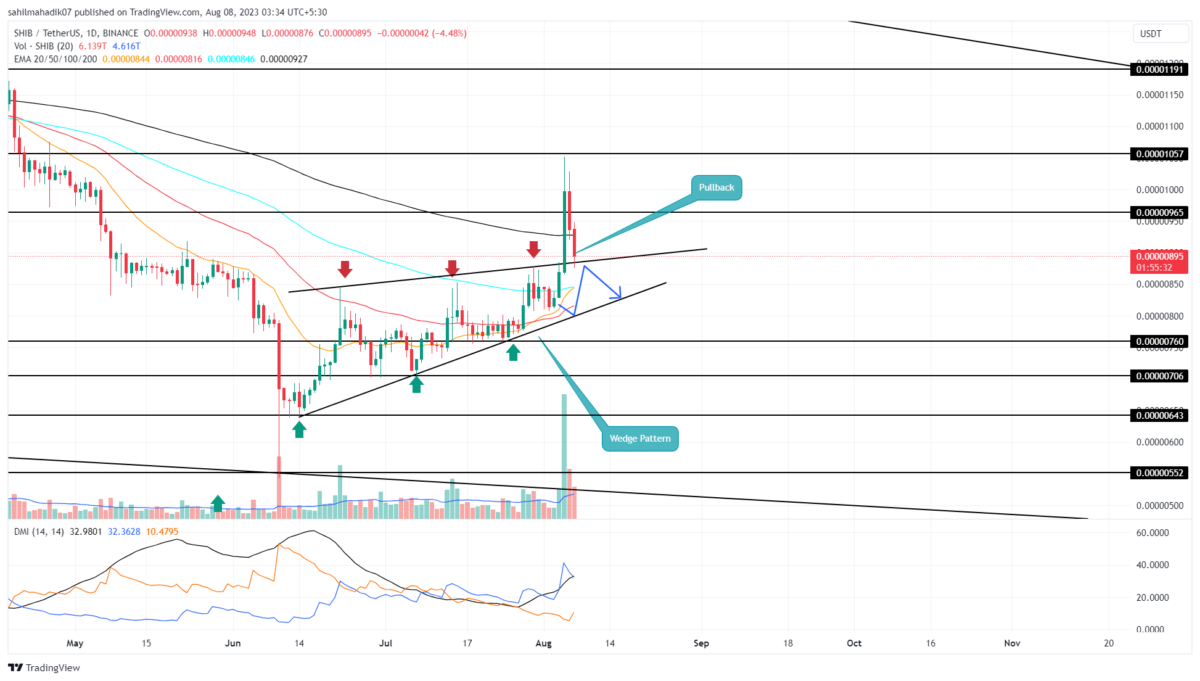
Shiba Inu Price Daily Chart:
- The SHIB price retraced to potential support for a bounce back to higher levels.
- A bullish crossover between the 20-and-100-day EMA would attract more buyers in the market
- The intraday trading volume of the Shiba Inu coin is $261.2 Million, showing a 38% loss.
On August 5th, the Shiba Inu price offered a high momentum breakout from the resistance trendline of a rising wedge pattern. In theory, this pattern often results in a significant downfall but in a rare case, it breaks the above resistance as a signal for increased buying pressure.
This breakout rally reached a high of $0.0000105 and reverted immediately. In the last two days, the coin price tumbled 11-12% and retested the breached resistance for potential support. By press time, the Shiba Inu price trades at $0.00000895, trying to sustain above the aforementioned trendline.
If the memecoin shows demand pressure from the rising trendline, the buyers may extend the price 18% higher to reach $0.0000105, followed by $0.0000119.
Can SHIB Price Revist $0.0000065?
If the sellers obtained the upper hand in the midst of increased uncertainty, the Shiba Inu price could see a breakdown below the flipped trendline. This breakdown would invalidate the bullish thesis and plunge the coin price to 6.5% to $0.0000085 to test the lower trendline of the wedge pattern.
- Average Directional Index: The daily ADX slope at 32% indicates the buyers’ enough ave strength
- Exponential Moving Average: The daily EMAs(20, 50, and 100) could offer additional support to coin buyers.
Recent Posts
- Price Analysis
Pi Network Analysis: Pi Coin Price Surges on Christmas Eve, Can It Hit Year-End Highs?
Pi coin price reflect cautious positioning as market structure tightens near a key base. The…
- Price Analysis
Why Dec 26th Is A Do Or Die for Bitcoin Price Ahead Of Record Options Expiry?
As Christmas winds down, the Bitcoin price dipped 0.74% to around $86,750. Market participants…
- Price Analysis
Why Bitcoin, Ethereum And XRP Prices Are Down Today? (24 Dec)
The crypto market extended losses ahead of Christmas as Bitcoin, Ethereum, and XRP slipped further…
- Price Analysis
XRP Price Prediction: Will 4 Billion Transactions Spark Next Rally?
XRP price trades below the $2 mark after the latest correction across the broader cryptocurrency…
- Price Analysis
Solana Price Outlook: Will SOL Recover With Strong Institutional Buying?
Solana price remains steady above the $120 support after the recent crypto market pullback. The…
- Price Analysis
Ethereum Price Risks Crash to $2,500 Amid Sustained Wintermute Dumping
Ethereum price dropped below the key support at $3,000 on Tuesday, down by ~40% from…