Shiba Inu Price Prediction As Token Burn Rate Surges 10x, Is SHIB Moving To $0.00001?

Shiba Inu (SHIB) is back on its upward trajectory which has been targeting highs above $0.00001 for several weeks now. The second-largest meme coin after Dogecoin temporarily abandoned the uptrend at $0.0000096 as profit-taking activities increased over the weekend.
Now that support has been confirmed at $0.00000837, SHIB price is back to trading at $0.00000865 amid a generally bullish outlook likely to close the gap to $0.00001 in the short-term.
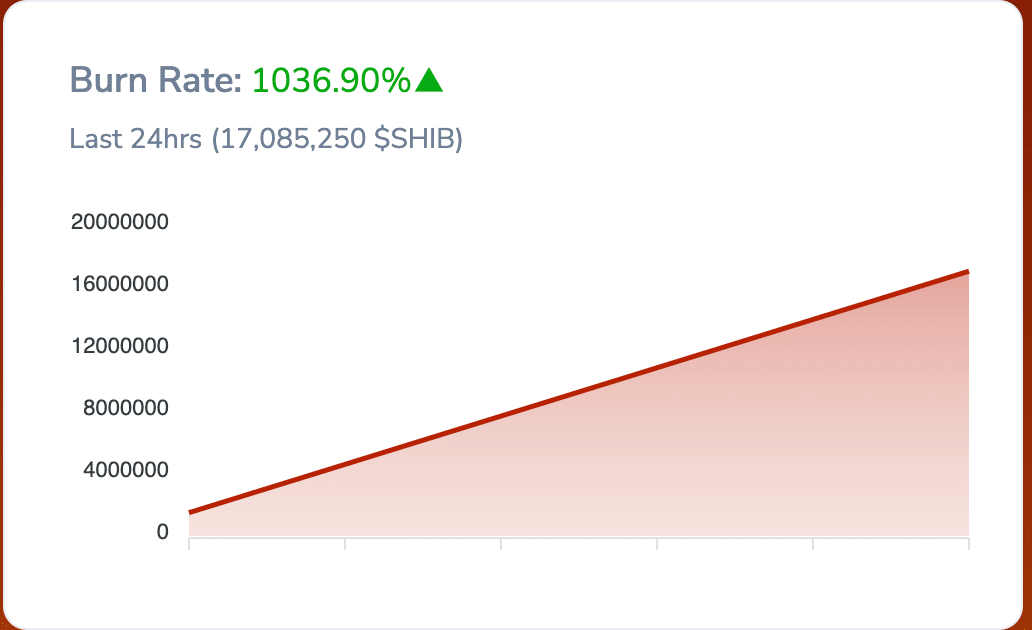
A massive increase in the token burn program by a whopping 1,030% shows that Shiba Inu is poised for a larger breakout. The token burn program aims at reducing SHIB’s available supply. As the supply and demand dynamics shift, Shiba Inu is expected to increase in value, with some believing a breakout above $1 is possible in the bull run.
Shiba Inu Price Prediction: SHIB Flaunts Double-Bottom Pattern
Shiba Inu has been trending higher from the time it bounced off support at $0.00000668 on October 20. The uptrend was gradual and lock-step at first with resistance at $0.000008 standing in the way.
A break above this hurdle in early November, reinforced the bullish grip, paving the way for the second phase of the recovery to $0.00001. This bullish leg extended above $0.000009 but a waning momentum saw Shiba Inu stall at $0.0000096, introducing a significant level of risk.
Shiba Inu price is in the process of validating a double-bottom pattern likely to result in an impressive 46% move from the breakout point to $0.0000145. This pattern formed toward the end of a downtrend. It signifies that selling pressure has faded to give way for bulls to take the reins.
Resistance is expected to delay the breakout at the dotted neckline. If successfully broken, a breakout will follow accompanied by increasing trading volume.
Traders are advised to place their buy orders slightly above the neckline resistance with a stop loss marginally below the same level. The massive increase in trading volume creates volatility and momentum for the climb, whose target is equal to the height of the pattern.
The Moving Average Convergence Divergence (MACD) indicator further reinforces the growing bullish grip with a buy signal. On top of the buy signal, the momentum indicator’s movement above the neutral area and further into the positive region, marks a change in SHIB’s trajectory.
A bullish cross on the same daily chart is another technical affirmation. This pattern reinforces the bullish narrative, validating a long-term outlook. It manifests when a short-term MA crosses above a long-term MA.
In SHIB’s case, the 50-day Exponential Moving Average (EMA) is pushing to flip above the 100-day EMA.
Despite bulls having a stronger case, traders would be looking for certain price actions before buying or selling SHIB this week. Those interested in longing Shiba Inu may want to wait until the ongoing gains trimming subside and give way to consolidation followed by a recovery above $0.000009. Such a move gives buyers time to seek more exposure while creating the necessary momentum for a massive rally past $0.00001.
On the other hand, Shiba Inu decline below the 200-day EMA (purple) at $0.00000837 might change the trajectory downwards. Although it would be prudent to anticipate a rebound at $0.000008 support, we cannot immediately rule out the impact of panic selling. Other support areas to consider are $0.000007 and $0.00000668.
Related Articles
- Breaking: Justin Sun’s Poloniex Exchange Suffers Over $100 Mln Asset Loss In Hacking Attack
- JPMorgan Introduces IFTTT Programmable Payments To JPM Coin
- Global Coalition Of 50 Nations Vows Rapid Adoption Of Crypto Reporting Framework
Recent Posts
- Price Analysis
Bitcoin Price Prediction As Michael Saylor Pauses BTC Purchase- Is A Fall to $74k Imminent?
Michael Saylor's Strategy has paused additional BTC purchases while increasing cash reserves, prompting renewed speculation…
- Price Analysis
Aster launched Phase 5 Buyback Program Allocating 80% Fees. Will ASTER Price Rally?
Aster price hovered above $0.70 following a 2.67% daily gain, supported by a bullish market…
- Price Analysis
XRP Price Prediction: Rare Bullish Patterns Align With Powerful Catalysts
The XRP price has stabilized in the past few days as it jumped by ~9%…
- Price Analysis
Weekly Crypto Price Prediction: Bitcoin, Ethereum, and XRP as Market Momentum Builds
As Christmas week begins, the crypto market shows early signs of recovery. Over the past…
- Price Analysis
Will Solana Price Hit $150 as Mangocueticals Partners With Cube Group on $100M SOL Treasury?
Solana price remains a focal point as it responds to both institutional alignment and shifting…
- Price Analysis
SUI Price Forecast After Bitwise Filed for SUI ETF With U.S. SEC – Is $3 Next?
SUI price remains positioned at a critical intersection of regulatory positioning and technical structure. Recent…