Shiba Inu Price Analysis : SHIB Price Advances Toward $0.000035 Amid Bullish Formation


SHIB price continues to move sideways for the fifth session in a row. The price takes support near the critical 50-day EMA. Traders are advised to wait for a decisive break out of the trading range before taking any aggressive bids.
- SHIB price consolidates with a positive bias on Tuesday.
- A bullish formation on the daily chart indicates impending bullish momentum.
- The downside is capped near the 50-day EMA at $0.000025.
As of press time, SHIB/USD trades at $0.000026, up 0.49% for the day. The 24-hour trading volume of the token holds at $836,767,112 with a loss of 24% as per the CoinMarketcap.
SHIB price trades sideways
On the daily chart, SHIB price consolidates below $0.000028 for the past few sessions. The price has formed a bullish reversal formation ‘ cup and handle’. The asset found reliable support around $0.000020, while the price retraced from the highs of $0.000029.
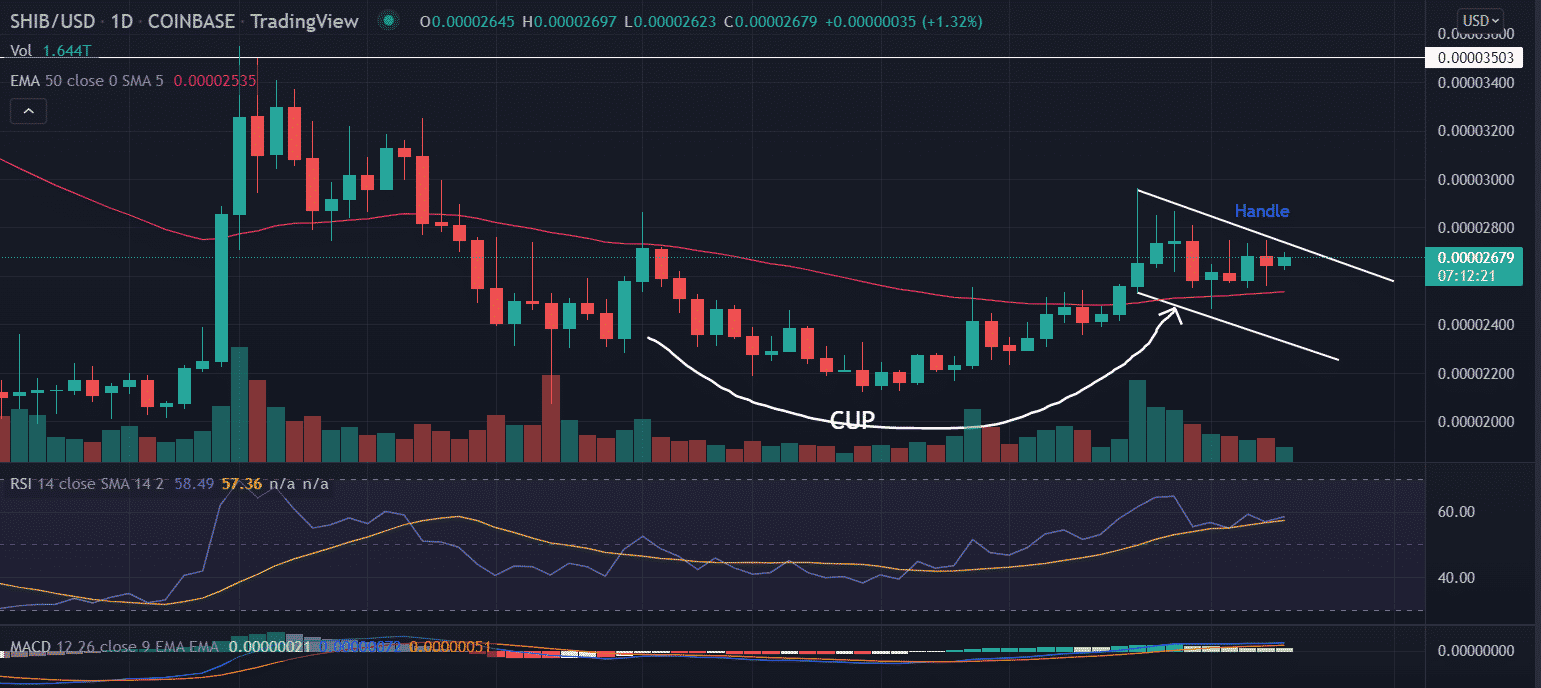
The probability of price falling below the 50-day EMA (Exponential Moving Average) looks less optimistic. The formation of multiple ‘Doji’ candlesticks suggests sellers are exhausted near the moving average.
Now a decisive break of the upper trendline of the formation will meet two immediate upside targets at $0.000028 and $0.000030.
Furthermore, the $0.000030 mark remains a crucial level to trade. An extended buying could push the price toward the ultimate target of $0.000035.
On the flip side, a spike in sell orders could disapprove of the bullish outlook on the asset. In that case, a fall below the 50-day EMA at $0.000025 could meet the horizontal support level at $0.000020.
Technical indicators:
RSI: The daily Relative Strength Index oscillates above the average line with a neutral bias. Any uptick in the indicator would advocates for the bullish bias.
MACD: The Moving Average Convergence Divergence trades above the mid-line.
Also Read : Shiba Inu Price Prediction 2022 : Will SHIB be the next Luna ?

Why Trust CoinGape
CoinGape has covered the cryptocurrency industry since 2017, aiming to provide informative insights Read more…to our readers. Our journal analysts bring years of experience in market analysis and blockchain technology to ensure factual accuracy and balanced reporting. By following our Editorial Policy, our writers verify every source, fact-check each story, rely on reputable sources, and attribute quotes and media correctly. We also follow a rigorous Review Methodology when evaluating exchanges and tools. From emerging blockchain projects and coin launches to industry events and technical developments, we cover all facets of the digital asset space with unwavering commitment to timely, relevant information.

Related Articles


- Fed Independence at Risk? Lummis and Hassett Discuss Powell Probe Amid Extravagant Spending Claims
- Gold Surges to All-Time High of $4,600 As Chaos Erupts in Iran- Will BTC Follow Soon?
- Breaking: Tom Lee’s BitMine Adds 24,266 Ethereum Ahead of BMNR Vote Deadline
- Trump vs. Powell: Crypto Traders Bet Against Fed Chair’s Indictment Despite DOJ Probe
- Breaking: Michael Saylor’s Strategy Acquires 13,627 Bitcoin Ahead Of CLARITY Act Markup
- Solana Price Targets $200 as WisdomTree Declares Its Dominance Structural
- Bitcoin Price Prediction Amid DOJ Probe as Powell Indictment Fears Cool
- Why is Monero (XMR) Price Up Today?
- Binance Coin Price Target $1,000 as CZ Signals Incoming Crypto Super Cycle
- Bitcoin and XRP Price Prediction Ahead of Supreme Court Tariffs Ruling on Jan 14, 2026
- Crypto Price Prediction Ahead of US CPI Inflation Data- ETH, ADA, Pi Coin


