Shiba Inu Price Prediction: Will $SHIB Price Rally to $0.000008 By October End?


Shiba Inu Price Prediction: As Bitcoin sustains its recovery above the $28,000 level, a renewed sense of bullish sentiment is permeating the crypto market. This shift has positively impacted the Shiba Inu coin, which recently bounced off the lower trendline of its falling wedge pattern at $0.0000063. Over the past three days, this bounce has resulted in a 5% gain, setting the stage for a potential breakout from its ongoing corrective phase.
Also Read: Investors Top Picks For High ROI: Cardano And Everlodge, While Shiba Inu Sees Significant Growth
Bullish Pattern Sets Potential Rally
- The coin price trading below the daily EMAs(20, 50, 100, and 200) indicates the overhead market trend is still bearish
- A bullish breakout from the wedge pattern could trigger a new recovery
- The intraday trading volume of the Shiba Inu coin is $72.5 Million, showing a 29% gain.
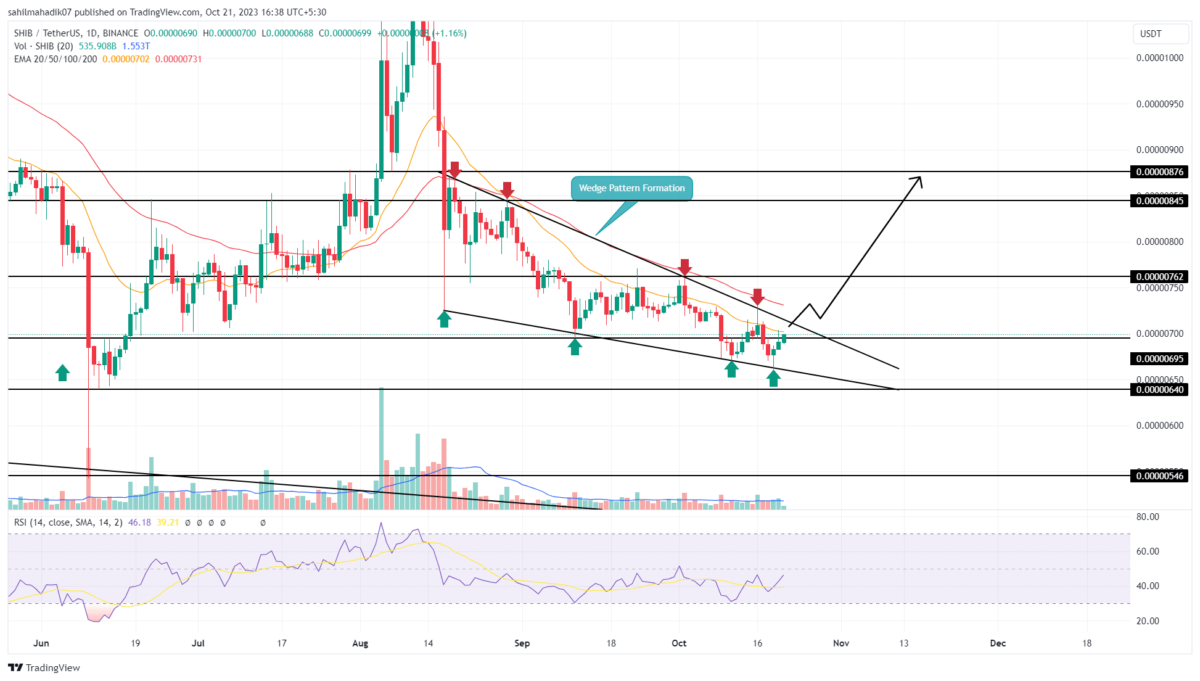
 Source- Tradingview
Despite market uncertainties, the SHIB price has been adhering to a well-defined falling wedge pattern over the last two months. This pattern has prompted four rebounds from its upper trendline and five from its lower, underscoring its strong influence on traders behavior.
As of October 19, the Shiba Inu price rebounded once again from the lower trendline, elevating it to its current trading level of $0.00000697. If buying pressure persists, we could see an additional 2% gain, which would represent an attempt to break out from the upper trendline, effectively signaling the end of its current correction.
Given the narrowing space between the two converging trendlines, a breakout seems imminent. A daily candle close above the upper trendline would likely intensify bullish momentum, potentially propelling the coin’s price 25% higher to reach the $0.00000876 mark.
Is SHIB Price Poised for Further Correction?
It’s essential to note that while the short-term outlook appears bullish, the existing trend remains bearish. For the past two months, the lower trendline has functioned as a safety net, protecting against a more severe correction. Should selling pressure breach this support, it could trigger accelerated selling, possibly pushing the price down to the $0.0000055 level.
- Exponential Moving Average: The 50-day EMA aligned with the upper trendline of the wedge pattern offers additional resistance against buyers.
- Relative Strength Index: The daily RSI slope above the 40% mark indicator shows bullish momentum is sufficient for significant recovery.

Why Trust CoinGape
CoinGape has covered the cryptocurrency industry since 2017, aiming to provide informative insights Read more…to our readers. Our journal analysts bring years of experience in market analysis and blockchain technology to ensure factual accuracy and balanced reporting. By following our Editorial Policy, our writers verify every source, fact-check each story, rely on reputable sources, and attribute quotes and media correctly. We also follow a rigorous Review Methodology when evaluating exchanges and tools. From emerging blockchain projects and coin launches to industry events and technical developments, we cover all facets of the digital asset space with unwavering commitment to timely, relevant information.
24 Hours volume
$168.45M
Market Cap
$3.84B
Max Supply
1000T

Related Articles


- CLARITY Act: White House to Hold Another Meeting as Crypto and Banks Stall on Stablecoin Yield Deal
- Bitcoin as ‘Neutral Global Collateral’? Expert Reveals How BTC Price Could Reach $50M
- XRP Ledger Validator Spotlights Upcoming Privacy Upgrade as Binance’s CZ Pushes for Crypto Privacy
- Harvard Management Co (HMC) Cuts BlackRock Bitcoin ETF Exposure by 21%, Rotates to Ethereum
- Morgan Stanley, Other TradFi Load Up SOL as Solana RWA Tokenized Value Hits $1.66B ATH
- Ethereum Price Outlook as Harvard Shifts Focus from Bitcoin to ETH ETF
- HOOD and COIN Stock Price Forecast as Expert Predicts Bitcoin Price Crash to $10k
- XRP Price Prediction Ahead of Supreme Court Trump Tariff Ruling
- Crypto Price Prediction For This Week: Dogecoin, Solana and Cardano
- Bitcoin Price Prediction: How Could Brazil’s Strategic Bitcoin Reserve Proposal Impact BTC?
- 3 Top Reasons Pi Network Price Surging Today (14 Feb)


