Shiba Inu Price Reversal Incoming? TD Sequential Points to a Bounce


Highlights
- TD Sequential signals a buy, hinting at a bullish SHIB reversal.
- Shiba Inu Price gains 6% as market sentiment improves across crypto assets.
- Technical indicators for SHIB suggest increasing buying pressure
Shiba Inu (SHIB) price appears poised for a rebound after consolidation and market decline. The memecoin has shown signs of recovery, gaining momentum alongside the broader cryptocurrency market. Over the past 24 hours, SHIB recorded a 6% uptick, hinting at a potential trend reversal. Technical indicators, including the TD Sequential, suggest a price bounce may be on the horizon.
Shiba Inu Price Signals Rebound as TD Sequential Flashes Buy Signal
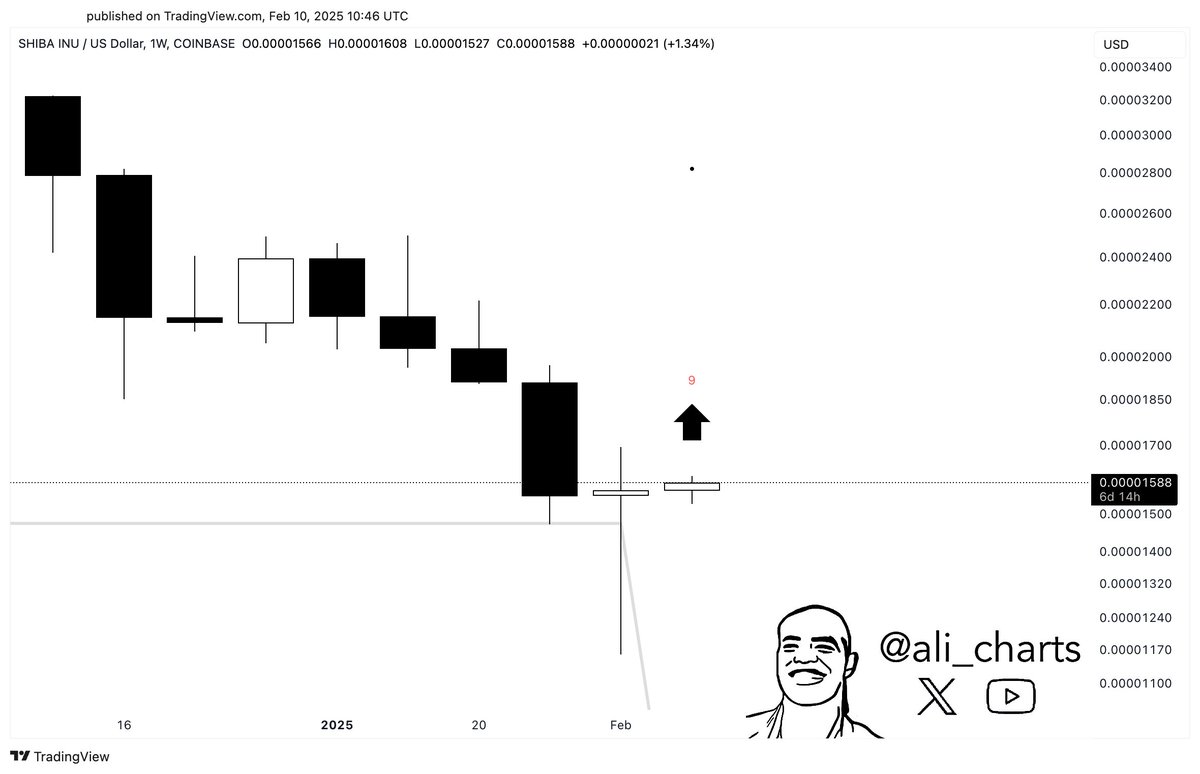
Shiba Inu price shows signs of a possible recovery as the TD Sequential indicator signals a buying opportunity on the weekly chart. This technical indicator, often used to identify potential trend reversals, suggests that SHIB might experience upward momentum following its recent decline.
The meme coin has been trading downward, with multiple consecutive red candles forming weekly. However, the emergence of a buy signal indicates that selling pressure may be easing, paving the way for a potential bullish shift.
Market analysts have noted that TD Sequential’s buy signals are historically significant in forecasting trend reversals. If this indicator proves accurate, SHIB could witness increased buying activity in the coming sessions.
The global crypto market cap is $3.18T, a 1% increase over the last few hours. The total crypto market volume over the last 24 hours is $125 billion, a 27.43% increase. BTC’s price has surged, currently hovering around $96k, and other altcoins like SHIB are also seeing a resurge.
Will SHIB Price Recover to $0.00002 This Week?
The latest SHIB price shows a slight recovery as the token attempts to regain lost ground. SHIB is trading at $0.00001669, reflecting a 6% increase over the last few hours. The price has been consolidating within a defined range, with immediate resistance at $0.000018 and support at $0.00001500.
The MACD histogram gradually shifts to the green zone, signaling potential upward movement. The RSI has climbed to 65, indicating increasing buying pressure, but still below the overbought threshold.
Based on the current technical outlook, potential upside targets include $0.00002 as an immediate resistance, followed by $0.000022 and $0.000025 if bullish momentum strengthens.
On the downside, key support levels to watch are $0.000015 and $0.000014, with a breakdown below this range potentially opening the door to $0.000012.

Shiba Inu price reversal could be on the horizon as technical indicators flash bullish signals. If buying pressure continues, SHIB may reclaim key resistance levels and sustain its recovery momentum.
Frequently Asked Questions (FAQs)
1. What is the TD Sequential indicator, and how does it impact SHIB?
2. Why is Shiba Inu’s price showing signs of a potential rebound?
3. What are the key resistance and support levels for SHIB?

Why Trust CoinGape
CoinGape has covered the cryptocurrency industry since 2017, aiming to provide informative insights Read more…to our readers. Our journal analysts bring years of experience in market analysis and blockchain technology to ensure factual accuracy and balanced reporting. By following our Editorial Policy, our writers verify every source, fact-check each story, rely on reputable sources, and attribute quotes and media correctly. We also follow a rigorous Review Methodology when evaluating exchanges and tools. From emerging blockchain projects and coin launches to industry events and technical developments, we cover all facets of the digital asset space with unwavering commitment to timely, relevant information.
24 Hours volume
$114.54M
Market Cap
$3.56B
Max Supply
1000T