SOL Price Analysis: Solana Poised for 12% Drop As Buyers Lost Crucial Support


During the first half of August, the Solana buyers tried to hold above the combined support of $22.4 and 50% Fibonacci retracement. However, from the latter half, this SOL Price witnessed aggressive selling pressure leading to a breakdown of the aforementioned support. This crackdown signals the continuation of the ongoing correction phase. Should you sell on this?
SOL Price Chart: Key Points
- The Solana price has been experiencing losses for four consecutive days.
- A breakdown below the $22.38 support triggers a 12% drop
- The 24-hour trading volume on the Solana coin is $486.5.5 Million, indicating a 10% gain.
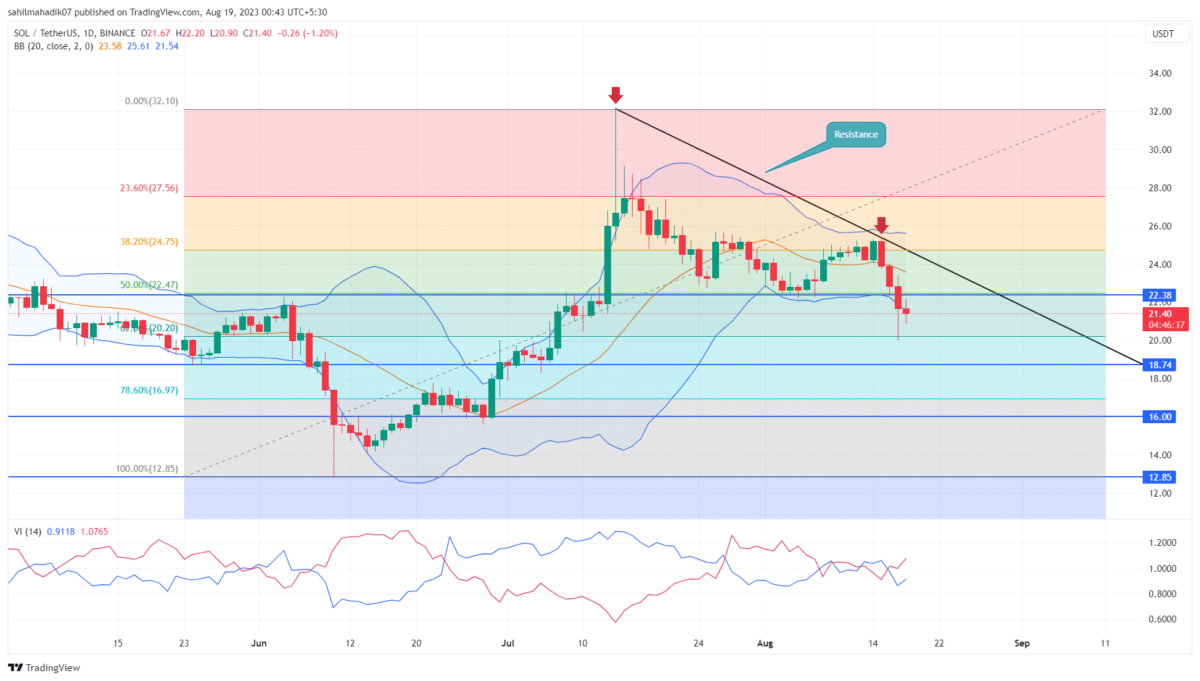
 Source-Tradingview
The Solana coin has been in a correction phase for the past five weeks. From the top of $32.13, the prices tumbled 33.4% to reach the current trading price of $21.39. This downfall obtained a significant boost on August 15th, the crypto market witnessed an intense sell-off in response to the Bitcoin price dip.
The SOL price breakdown from $22.38 support, offers sellers an additional resistance to pressurize the buyers. With sustained selling, the price could plummet another 12% to reach the $18.8 mark.
However, in the daily chart, the candle pattern shows lower price rejection, indicating the buyer’s attempt to counterattack. This buying pressure could trigger a minor pullback and retest the $22.38 as a valid resistance to short sell.
[converter id=”sol-solana” url=”https://coingape.com/price/converter/sol-to-usd/?amount=1″]
Will Solana Buyers Reverse Current Trend?
A downsloping trendline in the daily time frame chart is carrying the current correction phase. The sellers may use this dynamic resistance to sell at bullish bounces. Therefore, until this trendline is intact the downward correction may extend and the potential buyers must for a breakout above this barrier for trend change.
- Bollinger band: An downtick in the lower band of the Bollinger Band indicator reflects high momentum selling in the market.
- Vortex Indicator: A bearish crossover state between the V+(blue) and VI-(orange) indicate increasing sustained bearish momentum in the market

Why Trust CoinGape
CoinGape has covered the cryptocurrency industry since 2017, aiming to provide informative insights Read more…to our readers. Our journal analysts bring years of experience in market analysis and blockchain technology to ensure factual accuracy and balanced reporting. By following our Editorial Policy, our writers verify every source, fact-check each story, rely on reputable sources, and attribute quotes and media correctly. We also follow a rigorous Review Methodology when evaluating exchanges and tools. From emerging blockchain projects and coin launches to industry events and technical developments, we cover all facets of the digital asset space with unwavering commitment to timely, relevant information.

Related Articles


- Bitcoin vs Gold Feb 2026: Which Asset Could Spike Next?
- Top 3 Reasons Why Crypto Market is Down Today (Feb. 22)
- Michael Saylor Hints at Another Strategy BTC Buy as Bitcoin Drops Below $68K
- Expert Says Bitcoin Now in ‘Stage 4’ Bear Market Phase, Warns BTC May Hit 35K to 45K Zone
- Bitcoin Price Today As Bulls Defend $65K–$66K Zone Amid Geopolitics and Tariffs Tensions
- COIN Stock Price Prediction: Will Coinbase Crash or Rally in Feb 2026?
- Shiba Inu Price Feb 2026: Will SHIB Rise Soon?
- Pi Network Price Prediction: How High Can Pi Coin Go?
- Dogecoin Price Prediction Feb 2026: Will DOGE Break $0.20 This month?
- XRP Price Prediction As SBI Introduces Tokenized Bonds With Crypto Rewards
- Ethereum Price Rises After SCOTUS Ruling: Here’s Why a Drop to $1,500 is Possible


