SOL Price Analysis: Solana Poised for 12% Drop As Buyers Lost Crucial Support
During the first half of August, the Solana buyers tried to hold above the combined support of $22.4 and 50% Fibonacci retracement. However, from the latter half, this SOL Price witnessed aggressive selling pressure leading to a breakdown of the aforementioned support. This crackdown signals the continuation of the ongoing correction phase. Should you sell on this?
SOL Price Chart: Key Points
- The Solana price has been experiencing losses for four consecutive days.
- A breakdown below the $22.38 support triggers a 12% drop
- The 24-hour trading volume on the Solana coin is $486.5.5 Million, indicating a 10% gain.
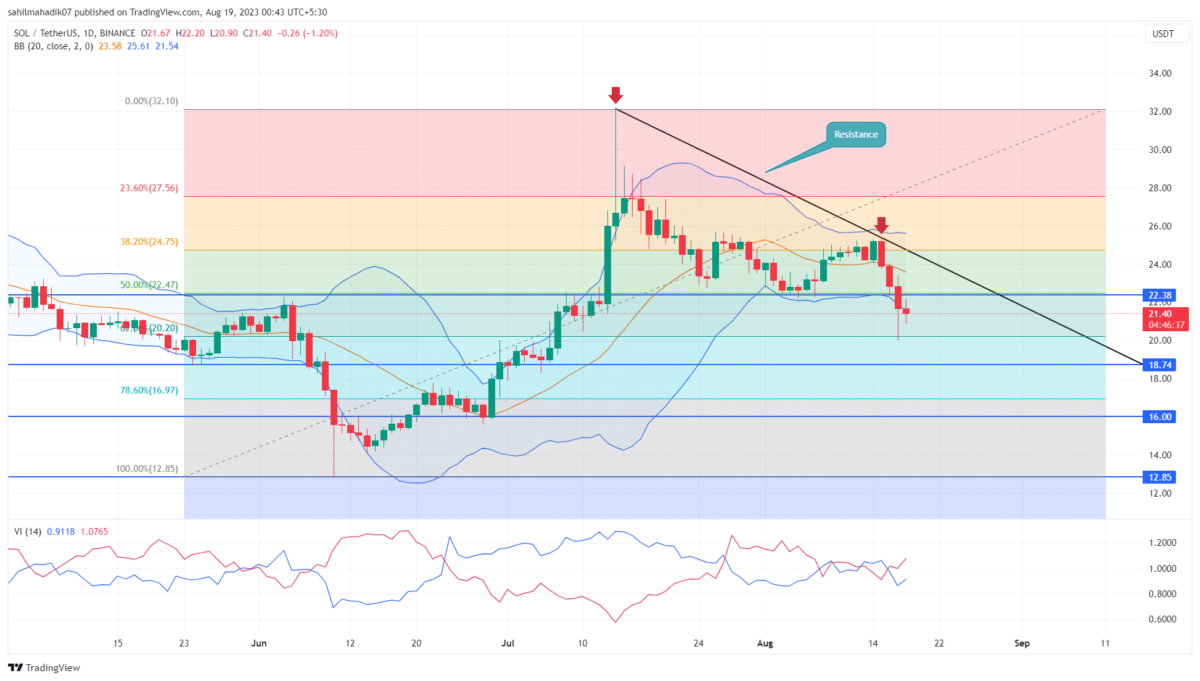
The Solana coin has been in a correction phase for the past five weeks. From the top of $32.13, the prices tumbled 33.4% to reach the current trading price of $21.39. This downfall obtained a significant boost on August 15th, the crypto market witnessed an intense sell-off in response to the Bitcoin price dip.
The SOL price breakdown from $22.38 support, offers sellers an additional resistance to pressurize the buyers. With sustained selling, the price could plummet another 12% to reach the $18.8 mark.
However, in the daily chart, the candle pattern shows lower price rejection, indicating the buyer’s attempt to counterattack. This buying pressure could trigger a minor pullback and retest the $22.38 as a valid resistance to short sell.
[converter id=”sol-solana” url=”https://coingape.com/price/converter/sol-to-usd/?amount=1″]
Will Solana Buyers Reverse Current Trend?
A downsloping trendline in the daily time frame chart is carrying the current correction phase. The sellers may use this dynamic resistance to sell at bullish bounces. Therefore, until this trendline is intact the downward correction may extend and the potential buyers must for a breakout above this barrier for trend change.
- Bollinger band: An downtick in the lower band of the Bollinger Band indicator reflects high momentum selling in the market.
- Vortex Indicator: A bearish crossover state between the V+(blue) and VI-(orange) indicate increasing sustained bearish momentum in the market
Recent Posts
- Price Analysis
Pi Coin Price Prediction as Expert Warns Bitcoin May Hit $70k After BoJ Rate Hike
Pi Coin price rose by 1.05% today, Dec. 18, mirroring the performance of Bitcoin and…
- Price Analysis
Cardano Price Outlook: Will the NIGHT Token Demand Surge Trigger a Rebound?
Cardano price has entered a decisive phase as NIGHT token liquidity rotation intersects with structural…
- Price Analysis
Will Bitcoin Price Crash to $74K as Japan Eyes Rate Hike on December 19?
Bitcoin price continues to weaken after breaking below its recent consolidation range, now trading within…
- Price Analysis
Bitwise Predicts Solana Price Will Hit New All-Time Highs in 2026
Solana price declined by 4% over the past 24 hours, breaking below the key $130…
- Price Analysis
Bitcoin Price Outlook: Capriole Founder Warns of a Drop Below $50K by 2028
Bitcoin price narratives continue to evolve as long-term downside risks regain attention. Bitcoin price discussions…
- Price Analysis
XRP Price Rare Pattern Points to a Surge to $3 as ETFs Cross $1B Milestone
XRP price dropped by 1.2% today, Dec. 17, continuing a downward trend that started in…