SOL Price Prediction: SOL Price Challenges 0.5% Fibonacci Retracement Near $110.


SOL price manages to print some gains on Saturday but within the limited price action. The recent downswing has pushed it to the vital support level near $98 indicating a bearish outlook. However, the formation of several ‘Doji’ candlesticks suggests indecision among traders as to what will happen next in the price.
- SOL price continues to consolidate below $102 with a neutral bias.
- A sustained buying pressure would challenge the 0.5% Fibonacci retracement near $110.
- The price exhibits strong support around the $95-$98 trading zone.
SOL price glides into a consolidation
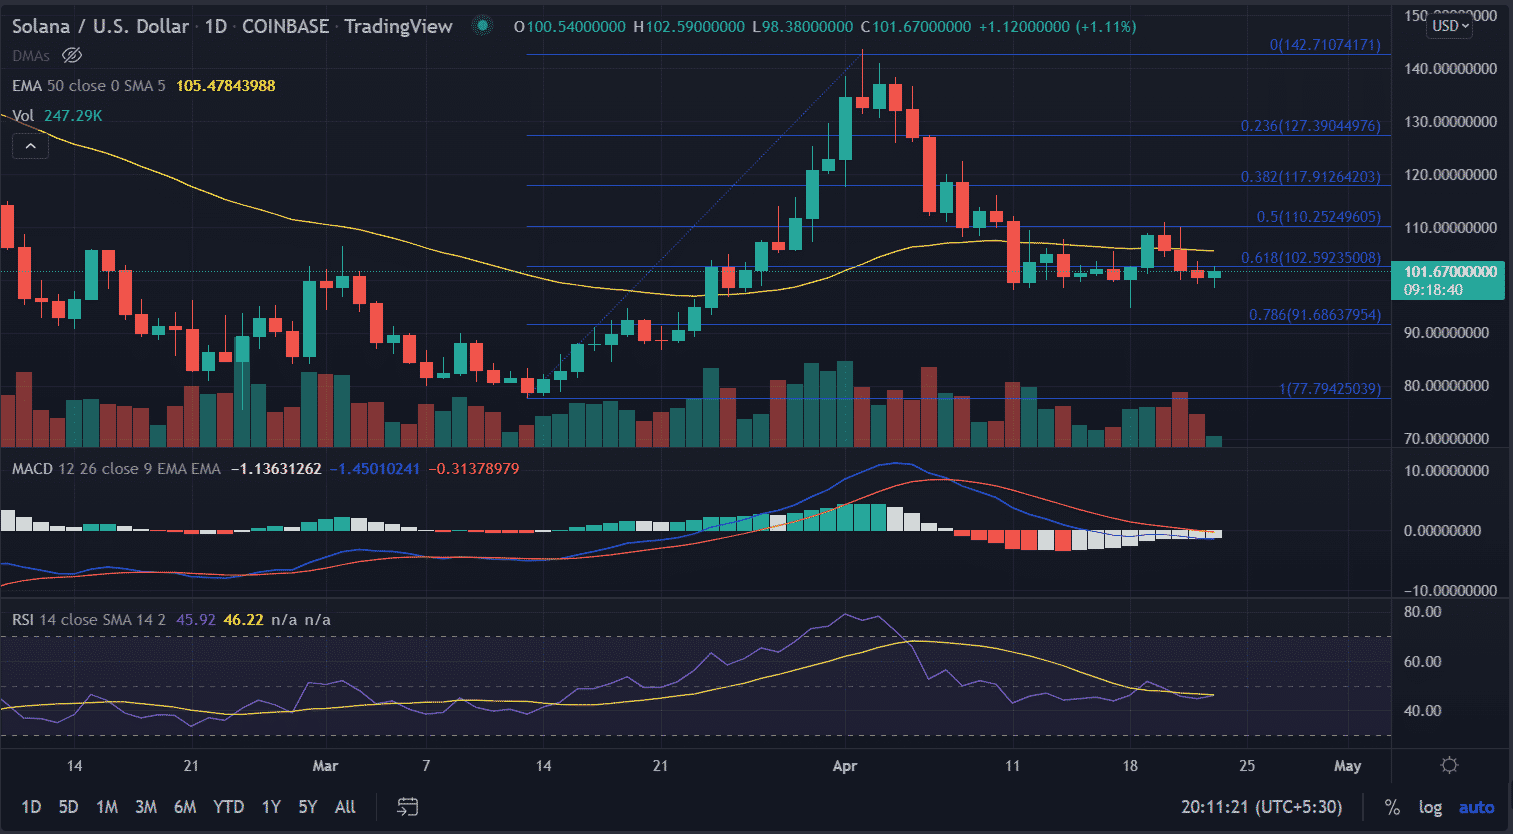
On the daily chart, the SOL price dropped 31% from the swing highs of $143.57, after the formation of a ‘hanging man’ candlestick pattern due to the considerable drop in the buying momentum. Now, the price has been in a short-term consolidation phase since it tested the swing low’s around $98.0 on April 11.
Currently, the price is hovering near the reliable support around $100.0 still below the critical 50-day ema (Exponential Moving Average) at $105.48. An acceptance above this moving average will open the gates for the highs of April 20 at $110.20, this also coincides with the 0.5% Fibonacci retracement.
On the flip side, a daily close below the low of the session would invalidate the bullish theory for the price. In that case, the bears would drag the price toward the lows of April 18 at $94.69. In addition to that, a resurgence in the selling pressure would push the price to the horizontal support zone at $90.0.
As of publication time, SOL/ USD is exchanging hands at $101.83, up 1.64% for the day. The seventh-largest cryptocurrency by the market cap is sustaining the 24-hour trading volume at $1,024,118,376 as updated by the CoinMarketCap.
Technical indicators:
MACD: The moving average convergence divergence hovers below the midline with a receding bearish momentum.
RSI: The relative strength index oscillates near the average line with no clear directional bias.

Why Trust CoinGape
CoinGape has covered the cryptocurrency industry since 2017, aiming to provide informative insights Read more…to our readers. Our journal analysts bring years of experience in market analysis and blockchain technology to ensure factual accuracy and balanced reporting. By following our Editorial Policy, our writers verify every source, fact-check each story, rely on reputable sources, and attribute quotes and media correctly. We also follow a rigorous Review Methodology when evaluating exchanges and tools. From emerging blockchain projects and coin launches to industry events and technical developments, we cover all facets of the digital asset space with unwavering commitment to timely, relevant information.