Solana Price Analysis: Bullish Pennant Pattern Signals a Surge Beyond $30


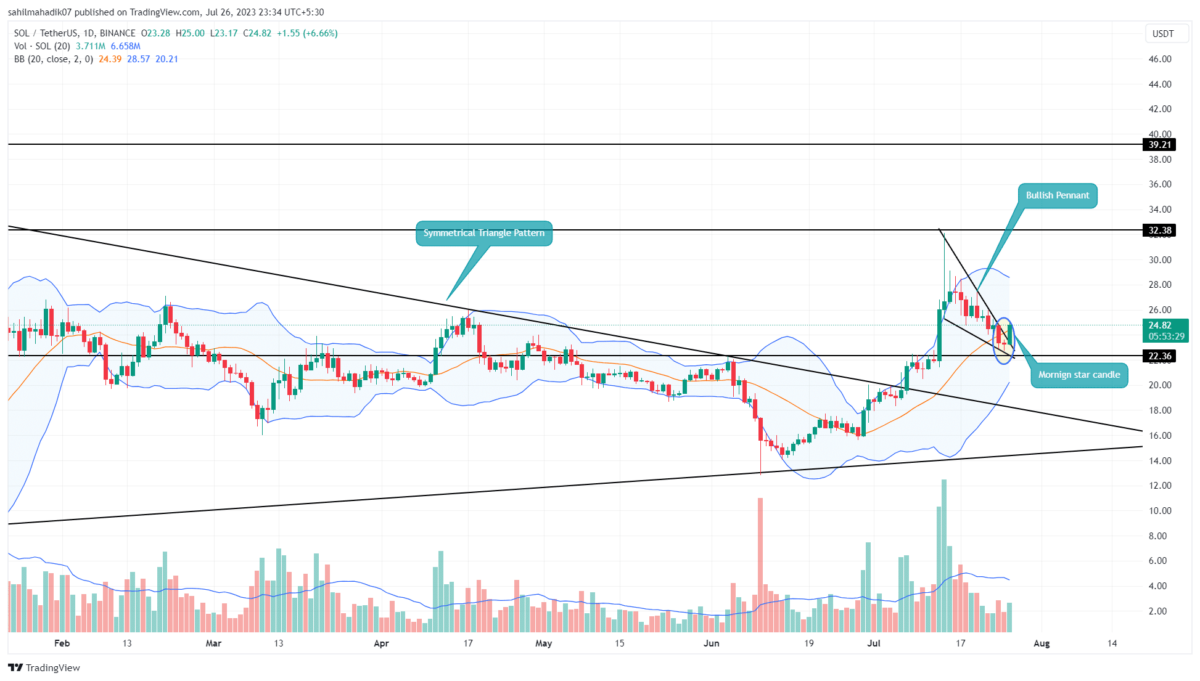
In response to the current correction phase in the crypto market, the Solana price witnessed a price drop from a $32.16 high to a $22.73 low. This two weeks’ downfall registered a 30% loss offering a pullback opportunity to the traders who missed the initial rally. Moreover, the daily time frame chart shows a bullish reversal morning star candle pattern, indicating the first sign of an uptrend continuation.
Also Read: What’s Next for Solana Price After a 120% Surge?
Solana Price Daily Chart
- A retracement to the 50% level reflects the overall bullish trend is intact
- A bullish breakout overhead resistance will offer buyers significant support to carry a recovery above $30
- The 24-hour trading volume on the Solana coin is $503.2 Million, indicating a 39% gain.
 Source-Tradingview
A closer look at the lower time frame shows the recent correction shaped into a pennant pattern. This chart pattern is often spotted in an established bull run offering a short break period before the continuation of the prevailing trend.
Within the intraday gain of 6.5%, the Solana price shows a bounce back from the combined support of $22.75 and 50% in the Fibonacci retracement level.
This upswing also provides a breakout from the resistance trendline of the pennant pattern. By press time, the Solana price trades at the $24.8 mark, and should obtain significant support from the breached trendline
With sustained buying the SOL price could rise 28% to challenge the $32.16 mark for a bullish breakout.
Can Solana Price Recovery Reach $50?
The recent upswing in the Solana price is also fuelled by the completion of a symmetrical triangle pattern. These chart patterns often come with predetermined targets, giving a potential level where the current price rally may mature. Therefore, under the influence of the triangle pattern, the Solana price is set for a recovery to $60.
- Super Trend: The green film projected in the daily chart accentuate the bullish trend persists.
- Direction Moving Index: The DI+(blue) and DI-(orange) expanding again in a bullish crossover state indicates the buying momentum in returning to the market.

Why Trust CoinGape
CoinGape has covered the cryptocurrency industry since 2017, aiming to provide informative insights Read more…to our readers. Our journal analysts bring years of experience in market analysis and blockchain technology to ensure factual accuracy and balanced reporting. By following our Editorial Policy, our writers verify every source, fact-check each story, rely on reputable sources, and attribute quotes and media correctly. We also follow a rigorous Review Methodology when evaluating exchanges and tools. From emerging blockchain projects and coin launches to industry events and technical developments, we cover all facets of the digital asset space with unwavering commitment to timely, relevant information.

Related Articles


- Peter Thiel Exits ETHZilla as Stock Slides 3% Amid Token Launch
- Bitwise, Granitshares Eyes $63B Sector With New Prediction Markets ETF Filing
- Breaking: Grayscale Sui Staking ETF to Start Trading on NYSE Arca Today
- Prediction Market Lawsuit: Nevada Targets Kalshi in Court After Action Against Polymarket
- Robinhood to Raise $1B IPO to Open Private Markets to Retail Investors
- How Long Will Pi Network Price Rally Continue?
- Pi Network Price Beats Bitcoin, Ethereum, XRP as Upgrades and Potential CEX Listing Fuels Demand
- 5 Things Dogecoin Price Needs to Hit $0.20 in Feb 2026
- Bitcoin Price Prediction as Experts Warns of Quantum Risks
- Dogecoin, Shiba Inu, Pepe Coin Price Predictions As BTC Crashes Below $68k
- Ethereum Price Outlook as Harvard Shifts Focus from Bitcoin to ETH ETF


