Solana Price Analysis: Here’s How $22.7 Support Sets $SOL for 25% Rally


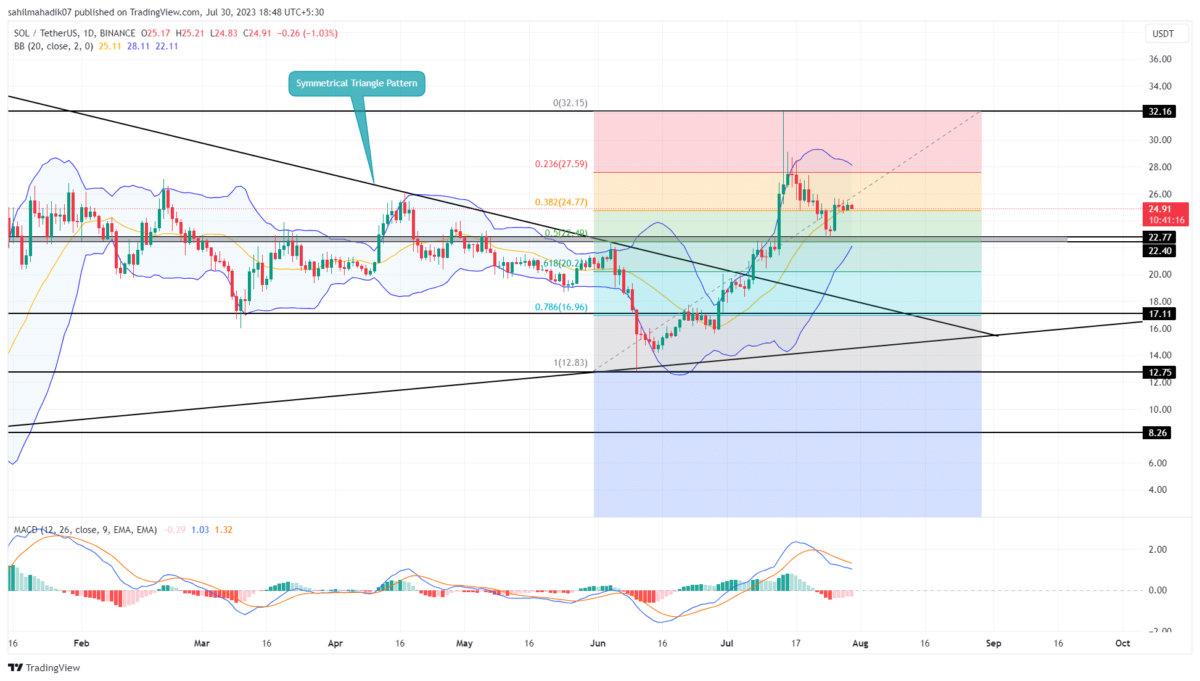
Solana Price Analysis: The Solana price recovery has recently faced a significant correction after hitting the $32.1 resistance. The two weeks retracement tumbled the coin’s market value by 29%, hitting the $22.7 support. The aforementioned level aligned with several other technical supports indicates a strong accumulation zone for buyers. Can this support recuperate the exhausted bullish momentum, or could sellers prolong the correction rally?
Also Read: Veteran Investor Raoul Pal Predicts A 20x Rally in Solana (SOL) Price
Solana Price Daily Chart
- Several short-bodied candles in the daily chart reflect uncertainty among SOL traders.
- A bullish breakout of $25.7 would signal the resumption of the recovery rally.
- The 24-hour trading volume on the Solana coin is $251.5 Million, indicating a 6.4% loss.
 Source-Tradingview
The falling Solana price found suitable support at the $22.7 level aligned with the 50% Fibonacci retracement level and 200-day EMA. In addition, a correction to the 50% level is considered a healthy pullback to replenish the market buying pressure.
On July 26th, the Solana price rebounded from $22.7 support with a morning star candle pattern as an early sign for uptrend continuation. The bullish reversal surged the prices by 11.2% and marked a top at $25.68.
However, the price trend turned sideways without offering a suitable follow-up indicating some weakness in bullish momentum. If the bearish market sentiment continues to pressurize crypto buyers, the SOL price may hover above $22.7 support for a few more trading days and hint at a requirement to build enough bullish momentum.
[converter id=”sol-solana” url=”https://coingape.com/price/converter/sol-to-usd/?amount=1″]
Will Solana Price Breach the $32 Barrier?
For Solana price to get an additional confirmation of bullish recovery, the buyers would need a daily candle closing above the morning star candle pattern high of $25.68. This breakout would bolster bulls to lead a 25.6% rally to $32.1. In addition, the ongoing recovery rally in SOL price is likely influenced by the symmetrical triangle pattern breakout. As per this chart pattern explained in a previous article the SOL price could rise to the $39.2-$40 mark under strong bullish conditions.
- Moving Average Convergence Divergence: A bearish crossover state in which the MACD slope(blue) moves below the signal line(orange) indicates the correction phase has not been completely invalidated.
- Bollinger Band: the downtick in the upper ceiling of the bollinger band indicator could offer additional resistance to rising prices

Why Trust CoinGape
CoinGape has covered the cryptocurrency industry since 2017, aiming to provide informative insights Read more…to our readers. Our journal analysts bring years of experience in market analysis and blockchain technology to ensure factual accuracy and balanced reporting. By following our Editorial Policy, our writers verify every source, fact-check each story, rely on reputable sources, and attribute quotes and media correctly. We also follow a rigorous Review Methodology when evaluating exchanges and tools. From emerging blockchain projects and coin launches to industry events and technical developments, we cover all facets of the digital asset space with unwavering commitment to timely, relevant information.
Related Articles


- Breaking: Bitcoin Bounces as U.S. House Passes Bill To End Government Shutdown
- Why Is The BTC Price Down Today?
- XRP’s DeFi Utility Expands as Flare Introduces Modular Lending for XRP
- Why Michael Saylor Still Says Buy Bitcoin and Hold?
- Crypto ETF News: BNB Gets Institutional Boost as Binance Coin Replaces Cardano In Grayscale’s GDLC Fund
- Ondo Price Prediction as MetaMask Integrates 200+ Tokenized U.S. Stocks
- XRP Price Risks Slide to $1 Amid Slumping XRPL Metrics and Burn Rate
- Gold and Silver Prices Turn Parabolic in One Day: Will Bitcoin Mirror the Move?
- Cardano Price Prediction as the Planned CME’s ADA Futures Launch Nears
- HYPE Price Outlook After Hyperliquid’s HIP-4 Rollout Sparks Prediction-Style Trading Boom
- Top 3 Meme coin Price Prediction: Dogecoin, Shiba Inu And MemeCore Ahead of Market Recovery


