
Solana Price Analysis: Here’s Why $SOL Price Recovery could Surpass $32


Solana Price Analysis: From Mid-June to July, the Solana price witnessed a parabolic growth and brought the recovery sentiment among market participants. From the June 10th low of $12.8, the recovery rally has currently topped $32.3 registering a growth of around 148%. However, the coin price couldn’t sustain above $30 and triggered a bearish correction. Can this minor outback fuel a rally above $30?
Also Read: Solana Introduces Ethereum Virtual Machine Rival “Solang”
Solana Price Daily Chart
- The correction backed by low-volume activity hints the current downfall is temporary
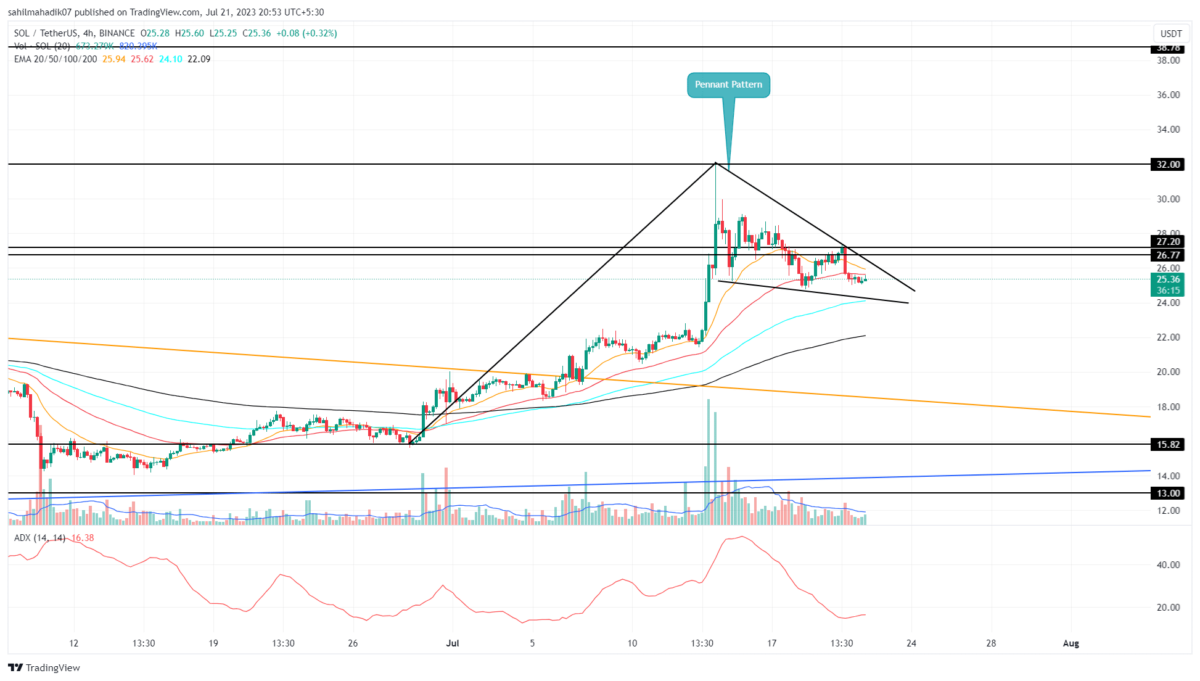
- A bullish breakout overhead resistance will offer buyers significant support to carry a recovery above $30
- The 24-hour trading volume on the Solana coin is $471.5 Million, indicating a 23% loss.
 Source-Tradingview
Amid the current uncertainty in the market, the Solana price turned down from the $30.2 barrier and tumbled 16%. However, this correction phase can be marked using two converging trendlines indicating the formation of a bullish pennant pattern. This continuation pattern usually occurs during an ongoing uptrend, suggesting that the uptrend is likely to resume after a brief consolidation period.
By the press time, the Solana price trades at $25.49, with an intraday loss of 0.24%. However, the recent downfall is still above 38.2% Fibonacci retracement level indicating this pullback is healthy for a higher price rally.
Interested traders must wait for a breakout of the overhead trendline as a signal for uptrend continuation.
[converter id=”sol-solana” url=”https://coingape.com/price/converter/sol-to-usd/?amount=1″]
Will the SOL Price Surpass $30?
Until the converging trendlines of the pennant pattern are intact, the Solana price may prolong its correction phase longer and lower. Therefore, an upside breakout from the resistance trendline with a daily candle closing will intensify the bullish momentum and lead to a recovery rally above $32. In theory, the flag and pennant pattern provides a predetermined target same as the pole-length shot from the breakout point. Thus, under the influence, the coin price could reach the $42 mark.
Exponential Moving Average: The SOL price above the daily EMAs(20, 50, 100, and 200) indicates the overall trend is bullish.
Average Directional Index: The ADX price at 44% indicates the recovery rally must be reaching maturity and thus, the current correction will restore the buyers’ strength.

Why Trust CoinGape
CoinGape has covered the cryptocurrency industry since 2017, aiming to provide informative insights Read more…to our readers. Our journal analysts bring years of experience in market analysis and blockchain technology to ensure factual accuracy and balanced reporting. By following our Editorial Policy, our writers verify every source, fact-check each story, rely on reputable sources, and attribute quotes and media correctly. We also follow a rigorous Review Methodology when evaluating exchanges and tools. From emerging blockchain projects and coin launches to industry events and technical developments, we cover all facets of the digital asset space with unwavering commitment to timely, relevant information.


