Solana Price Analysis: Here’s Why $SOL Price Hold the Potential to Surpass $30


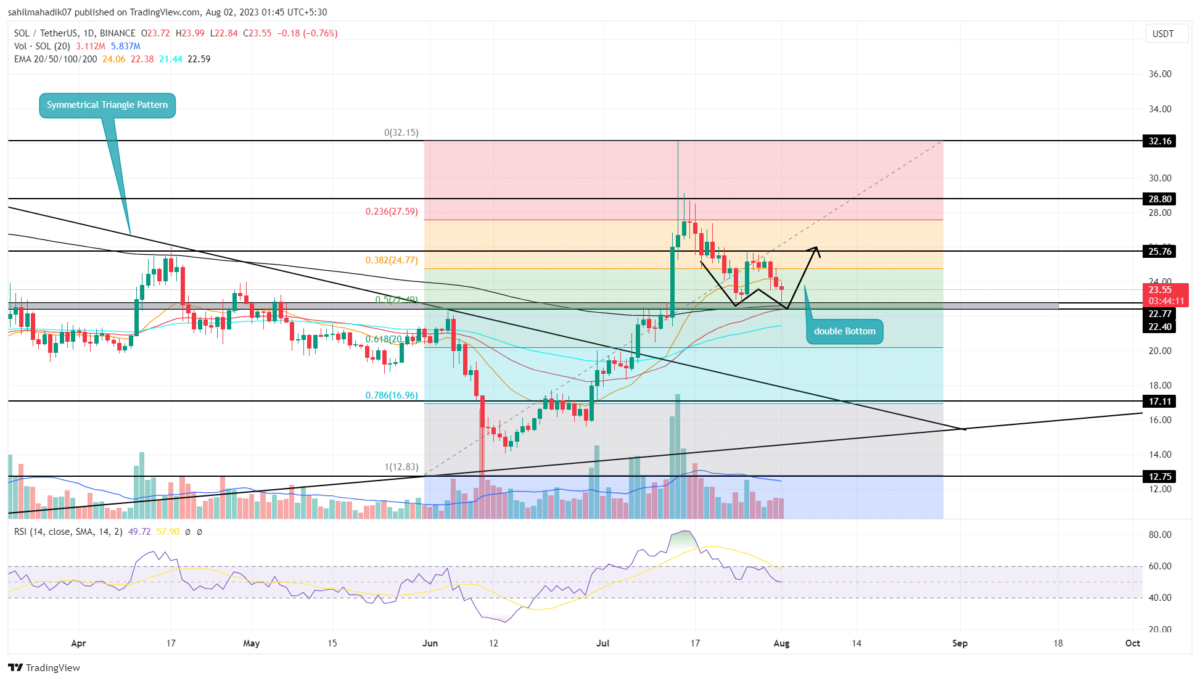
Solana Price Analysis: The recent correction phase in Solana price found suitable support at $22.7. This horizontal level combined with the 50% Fibonacci replacement level, creates a strong demand zone for market participants. On July 26th, the coin price tried to bounce back from the aforementioned support with the morning star candle, but the buyers’ failure to give a suitable follow-up indicates insufficient bullish momentum to resume price recovery.
Also Read: Solana Price Analysis: Here’s How $22.7 Support Sets $SOL for 25% Rally
Solana Price Daily Chart
- The accumulation of several technical levels at $22.7 creates a high area of interest for market participants.
- The Solana price trading above 100-and-200-day EMA reflects the overall trend that remains bullish.
- The 24-hour trading volume on the Solana coin is $418.5 Million, indicating a 3.6% gain.
 Source-Tradingview
By the press time, the Solana price traded at $23.72 and showed a long rejection candle at $22.7 support. These two reversals from the same support within a fortnight indicate the presence of strong demand pressure.
A potential reversal would lead to the formation of a bullish reversal pattern called the double bottom. This pattern is a sign of active accumulation from traders and the possibility of a sustained rally.
If the coin price gives a bullish breakout from the $25.75 resistance, the buyers would get a solid springboard to jump higher. The post-breakout rally could surge the prices 12.5% higher to hit $29, followed by $32.
Solana Price Breakdown to $20?
In case the Solana price continues to waver above the $22.7 support without a sustained rebound, the strength of buyers to continue a recovery rally would be under question. A breakdown below $22.4 would accelerate the selling pressure and push the coin price to $20.
- Exponential moving average: The 50-and-100- day EMA nearing a bullish crossover near $22.5 increasing the support strength of this level.
- Relative Strength Index: Despite the falling RSI slope, the coin price maintains a higher low formation indicating a reverse bullish divergence which favors the uptrend continuation

Why Trust CoinGape
CoinGape has covered the cryptocurrency industry since 2017, aiming to provide informative insights Read more…to our readers. Our journal analysts bring years of experience in market analysis and blockchain technology to ensure factual accuracy and balanced reporting. By following our Editorial Policy, our writers verify every source, fact-check each story, rely on reputable sources, and attribute quotes and media correctly. We also follow a rigorous Review Methodology when evaluating exchanges and tools. From emerging blockchain projects and coin launches to industry events and technical developments, we cover all facets of the digital asset space with unwavering commitment to timely, relevant information.
Related Articles


- Breaking: Bitcoin Bounces as U.S. House Passes Bill To End Government Shutdown
- Why Is The BTC Price Down Today?
- XRP’s DeFi Utility Expands as Flare Introduces Modular Lending for XRP
- Why Michael Saylor Still Says Buy Bitcoin and Hold?
- Crypto ETF News: BNB Gets Institutional Boost as Binance Coin Replaces Cardano In Grayscale’s GDLC Fund
- Ondo Price Prediction as MetaMask Integrates 200+ Tokenized U.S. Stocks
- XRP Price Risks Slide to $1 Amid Slumping XRPL Metrics and Burn Rate
- Gold and Silver Prices Turn Parabolic in One Day: Will Bitcoin Mirror the Move?
- Cardano Price Prediction as the Planned CME’s ADA Futures Launch Nears
- HYPE Price Outlook After Hyperliquid’s HIP-4 Rollout Sparks Prediction-Style Trading Boom
- Top 3 Meme coin Price Prediction: Dogecoin, Shiba Inu And MemeCore Ahead of Market Recovery


