Solana Price Analysis: Here’s Why $SOL Price Hold the Potential to Surpass $30
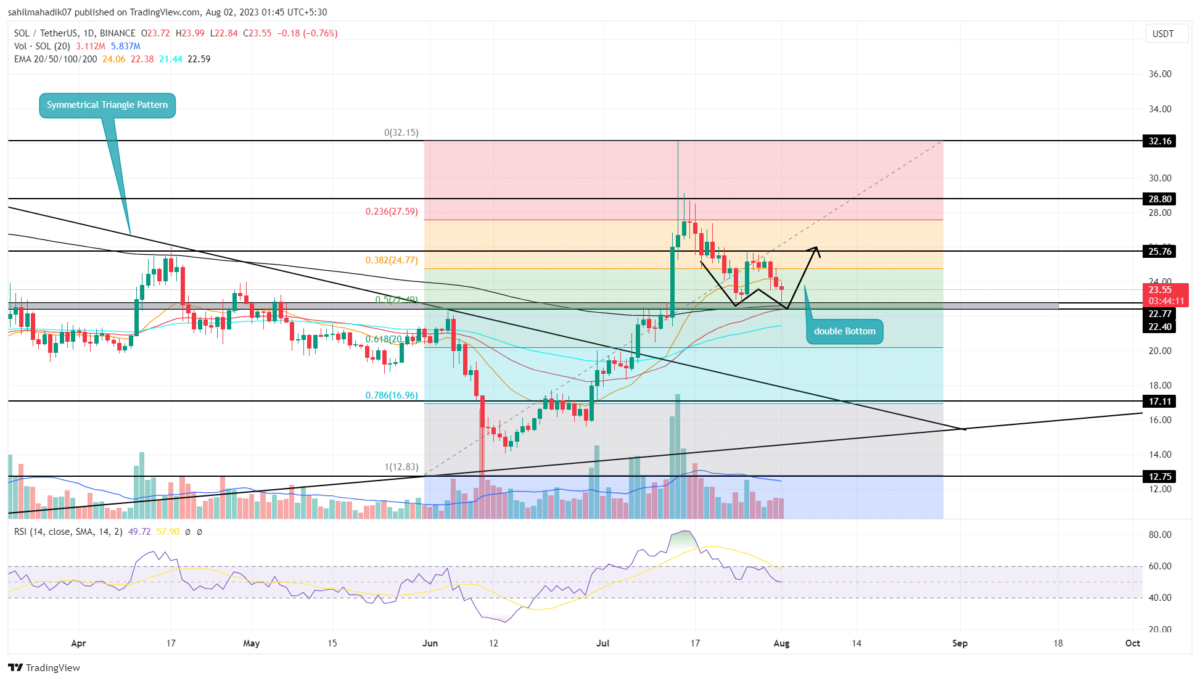
Solana Price Analysis: The recent correction phase in Solana price found suitable support at $22.7. This horizontal level combined with the 50% Fibonacci replacement level, creates a strong demand zone for market participants. On July 26th, the coin price tried to bounce back from the aforementioned support with the morning star candle, but the buyers’ failure to give a suitable follow-up indicates insufficient bullish momentum to resume price recovery.
Also Read: Solana Price Analysis: Here’s How $22.7 Support Sets $SOL for 25% Rally
Solana Price Daily Chart
- The accumulation of several technical levels at $22.7 creates a high area of interest for market participants.
- The Solana price trading above 100-and-200-day EMA reflects the overall trend that remains bullish.
- The 24-hour trading volume on the Solana coin is $418.5 Million, indicating a 3.6% gain.
By the press time, the Solana price traded at $23.72 and showed a long rejection candle at $22.7 support. These two reversals from the same support within a fortnight indicate the presence of strong demand pressure.
A potential reversal would lead to the formation of a bullish reversal pattern called the double bottom. This pattern is a sign of active accumulation from traders and the possibility of a sustained rally.
If the coin price gives a bullish breakout from the $25.75 resistance, the buyers would get a solid springboard to jump higher. The post-breakout rally could surge the prices 12.5% higher to hit $29, followed by $32.
Solana Price Breakdown to $20?
In case the Solana price continues to waver above the $22.7 support without a sustained rebound, the strength of buyers to continue a recovery rally would be under question. A breakdown below $22.4 would accelerate the selling pressure and push the coin price to $20.
- Exponential moving average: The 50-and-100- day EMA nearing a bullish crossover near $22.5 increasing the support strength of this level.
- Relative Strength Index: Despite the falling RSI slope, the coin price maintains a higher low formation indicating a reverse bullish divergence which favors the uptrend continuation
Recent Posts
- Price Analysis
Pi Coin Price Prediction as Expert Warns Bitcoin May Hit $70k After BoJ Rate Hike
Pi Coin price rose by 1.05% today, Dec. 18, mirroring the performance of Bitcoin and…
- Price Analysis
Cardano Price Outlook: Will the NIGHT Token Demand Surge Trigger a Rebound?
Cardano price has entered a decisive phase as NIGHT token liquidity rotation intersects with structural…
- Price Analysis
Will Bitcoin Price Crash to $74K as Japan Eyes Rate Hike on December 19?
Bitcoin price continues to weaken after breaking below its recent consolidation range, now trading within…
- Price Analysis
Bitwise Predicts Solana Price Will Hit New All-Time Highs in 2026
Solana price declined by 4% over the past 24 hours, breaking below the key $130…
- Price Analysis
Bitcoin Price Outlook: Capriole Founder Warns of a Drop Below $50K by 2028
Bitcoin price narratives continue to evolve as long-term downside risks regain attention. Bitcoin price discussions…
- Price Analysis
XRP Price Rare Pattern Points to a Surge to $3 as ETFs Cross $1B Milestone
XRP price dropped by 1.2% today, Dec. 17, continuing a downward trend that started in…