Solana Price Analysis: Will $SOL Price Surpass $27 Amidst Current Recovery Cycle?
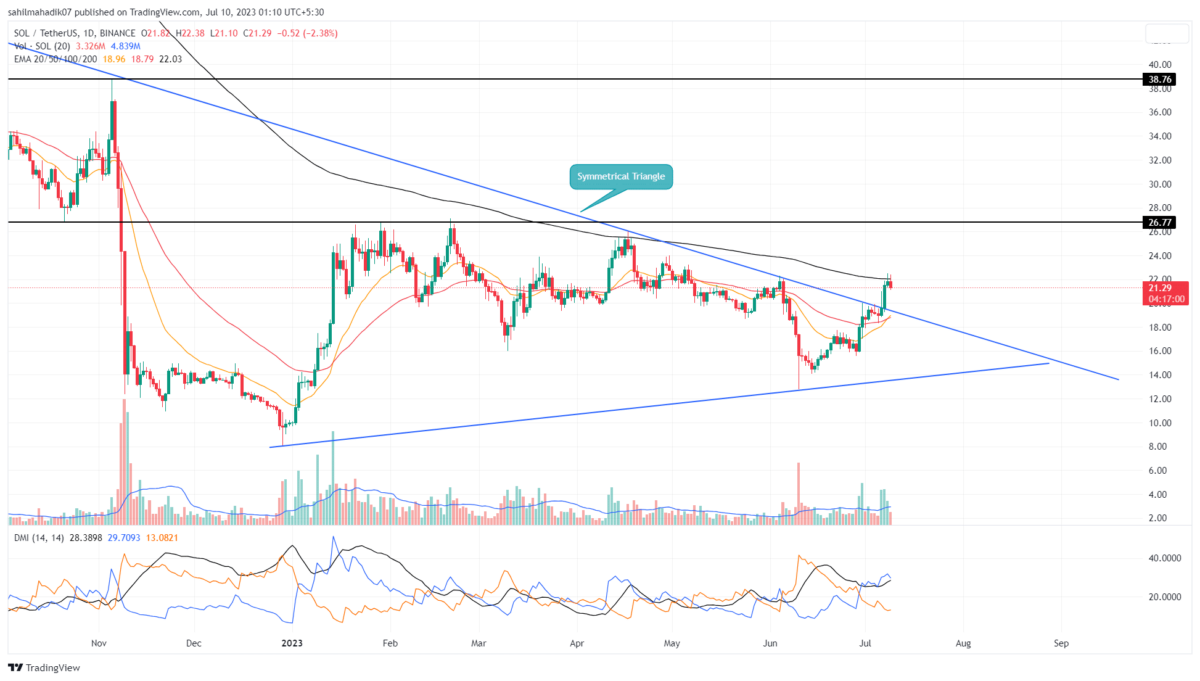
Solana Price Analysis: Over the past seven months, the Solana price traveled in a sideways trend during which it resonated between two converging trendlines acting as major resistance and support. In the daily time frame chart, this trendline structure projected the formation of a symmetrical triangle pattern, offering an opportunity for a directional move upon the breakout of either trendline. Amid the recent growth in the crypto market, the SOL buyers provided a bullish breakout from the triangle pattern, paying the way for further recovery in the near future.
Also Read: Solana Price Recovery: Analyst Sets $27 Price Target for $SOL
Solana Price Daily Chart
- A symmetrical triangle pattern resulted on a bullish note projecting a significant rally underway
- A bullish crossover between the 20-and-100-day EMA project additional confirmation
- The 24-hour trading volume on the Solana coin is $146.5 Million, indicating a 37% loss.
On July 7th, the fast recovery Solana price provided a massive breakout from the resistance trendline of a symmetrical triangle pattern. The following day, the coin price offered a follow-up green candle but the higher price rejection reflected the selling pressure rising.
However, this rejection candle could be profit booking from short-term traders suggesting a minor pullback is possible before the next leap. Currently, the SOL price trades at $21.3 and shows an intraday loss of 2.34%.
This potential pullback could plunge the price by 10% to retest the breach trendline and recuperate the bullish momentum.
Will Solana Price Rise to $27?
After a remarkable recovery in the last four weeks, the Solana price is likely to take a short break before the bull run continues. The pullback could be beneficial for buyers to restore bullish momentum and check price stability at a higher price. If prices manage to sustain above the breach trendline, the buyers could drive a 25% rally and hit the next supply zone of $27, followed by $38.7.
- Exponential Moving Average:: The SOL price turned down from the 200-day EMA resistance stands as the last barrier for sellers to reclaim higher prices.
- Directional Movement Index: The DI+ slope(blue) above the DI- line(orange) and moving further reflect the rising buying pressure among traders.
Recent Posts
- Price Analysis
Will Solana Price Hit $150 as Mangocueticals Partners With Cube Group on $100M SOL Treasury?
Solana price remains a focal point as it responds to both institutional alignment and shifting…
- Price Analysis
SUI Price Forecast After Bitwise Filed for SUI ETF With U.S. SEC – Is $3 Next?
SUI price remains positioned at a critical intersection of regulatory positioning and technical structure. Recent…
- Price Analysis
Bitcoin Price Alarming Pattern Points to a Dip to $80k as $2.7b Options Expires Today
Bitcoin price rebounded by 3% today, Dec. 19, reaching a high of $87,960. This rise…
- Price Analysis
Dogecoin Price Prediction Points to $0.20 Rebound as Coinbase Launches Regulated DOGE Futures
Dogecoin price has gone back to the spotlight as it responds to the growing derivatives…
- Price Analysis
Pi Coin Price Prediction as Expert Warns Bitcoin May Hit $70k After BoJ Rate Hike
Pi Coin price rose by 1.05% today, Dec. 18, mirroring the performance of Bitcoin and…
- Price Analysis
Cardano Price Outlook: Will the NIGHT Token Demand Surge Trigger a Rebound?
Cardano price has entered a decisive phase as NIGHT token liquidity rotation intersects with structural…