Solana Price at $22.4 Support: Is a Double Bottom Recovery in the Cards?
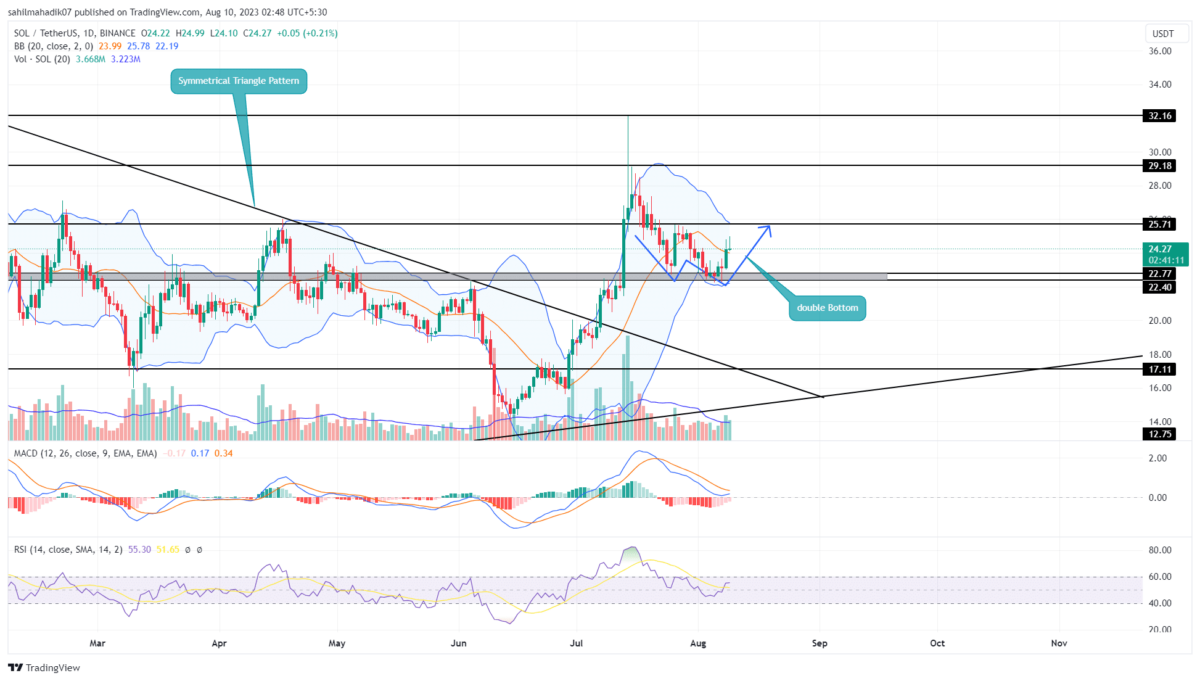
Solana Price Analysis: Amid the rising FUD in the crypto market, the ninth-largest cryptocurrency Solana is hovering at about $22.4 support. In the last three weeks, the SOL price has bounced twice from the aforementioned support indicating the active accumulation from market participation. A closer look at the daily time frame chart shows this reversal as the formation of a bullish double-bottom pattern.
Also Read: Digital Asset Outflows Surge, Solana And XRP Lead Impressive Weekly Inflows: Report
Solana Price Daily Chart
- The $22.4 stands as strong support for traders.
- A bullish breakout from $24.4 resistance would set the SOL price for a 12.4% jump
- The 24-hour trading volume on the Solana coin is $486.5.5 Million, indicating a 10% gain.
In the daily time frame chart, the Solana price shows the formation of a double bottom pattern. This pattern is often spotted at the market bottom bolstering buyers for a sustainable rally.
On August 7, the reverted from the $22.4 support. The reversal surged the price by 8.8% and reached the current trading price of $24.36. Under the influence of this chart setup, the surprise is likely to rise another 5.8% to challenge the overhead necklines of $25.7.
A bullish breakout from the above-mentioned resistance line will accelerate the buying pressure and surge prices to $29-$30.
SOL Price Heading to $18?
In case the SOL price witnesses aggressive selling at the $22.4 barrier, the coin price is likely to go sideways and create a narrow range formation. Despite a push from market buyers, the altcoin price walking a lateral path would indicate weakness in bullish momentum. If the sellers take advantage of this uncertainty a breakdown below $22.4 will lead correction phase to $18.7
- Bollinger band: An upswing in the lower band of the Bollinger Band indicator offers additional support to market buyers.
- Relative Strength Index: The daily RSI slope’s potential rise above 60% would reflect strong sentiment among traders.
Recent Posts
- Price Analysis
Will Solana Price Hit $150 as Mangocueticals Partners With Cube Group on $100M SOL Treasury?
Solana price remains a focal point as it responds to both institutional alignment and shifting…
- Price Analysis
SUI Price Forecast After Bitwise Filed for SUI ETF With U.S. SEC – Is $3 Next?
SUI price remains positioned at a critical intersection of regulatory positioning and technical structure. Recent…
- Price Analysis
Bitcoin Price Alarming Pattern Points to a Dip to $80k as $2.7b Options Expires Today
Bitcoin price rebounded by 3% today, Dec. 19, reaching a high of $87,960. This rise…
- Price Analysis
Dogecoin Price Prediction Points to $0.20 Rebound as Coinbase Launches Regulated DOGE Futures
Dogecoin price has gone back to the spotlight as it responds to the growing derivatives…
- Price Analysis
Pi Coin Price Prediction as Expert Warns Bitcoin May Hit $70k After BoJ Rate Hike
Pi Coin price rose by 1.05% today, Dec. 18, mirroring the performance of Bitcoin and…
- Price Analysis
Cardano Price Outlook: Will the NIGHT Token Demand Surge Trigger a Rebound?
Cardano price has entered a decisive phase as NIGHT token liquidity rotation intersects with structural…