Solana Price Path to $30; Double Bottom Pattern Sparks Bullish Upswing
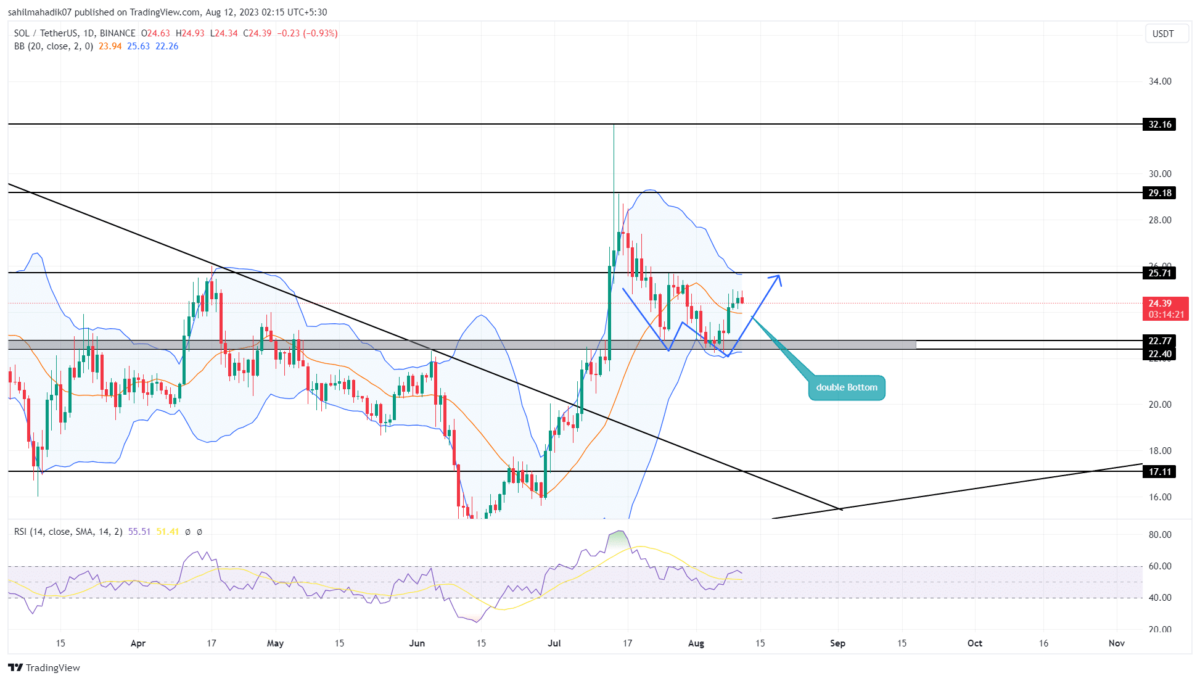
Taking a closer look at the daily time frame chart, the Solana price shows the formation of a double bottom pattern. This pattern often manifests itself at the market bottom, indicating a strong potential for an upward movement in prices. The double bottom consists of two successive troughs, both supported by a common price level – in this case, the $22.4 mark. Here are the potential targets if the chart pattern gets complete.
Also Read: Digital Asset Outflows Surge, Solana And XRP Lead Impressive Weekly Inflows
Solana Price Daily Chart
- The formation of a double bottom pattern indicates the market participants are taking heed of the accumulation potential and positioning themselves for potential gains
- The SOL price may witness high supply pressure at the $25.7 resistance
- The 24-hour trading volume on the Solana coin is $315.5 Million, indicating a 5.7% gain.
On August 7, the coin price experienced a notable reversal from the $22.4 support level. This reversal led to an impressive 9% surge, propelling the SOL price value to its current trading price of $24.45. This swift turnaround can be attributed to the bullish sentiment generated by the double-bottom pattern formation.
The current chart setup hints at a possible 5.8% price rise for SOL, bringing it closer to testing the resistance at $25.7. A successful breach here would indicate a bullish breakout, potentially triggering stronger buying activity and driving the price toward the $29 to $30 range, and followed by $32.
What if SOL Price Witness Higher Selling Pressure?
In the daily time frame chart, the Solana price has started to project higher upside wicks and short bodies, indicating the weakening of bullish momentum. If the altcoin approaches $25.7 and witnesses additional supply pressure, the price trend may turn sideways and create a narrow range for a few trading sessions. This consolidation may remove the weak and trigger a direction movement.
- Bowling band: The Bollinger Band indicator going flattish accentuates a sideways or no directional bias in the market right now.
- Relative Strength Index: The daily RSI slope potential rise above 50% indicates a suitable scenario for a bullish upswing.
Recent Posts
- Price Analysis
Dogecoin Price Prediction Points to $0.20 Rebound as Coinbase Launches Regulated DOGE Futures
Dogecoin price has gone back to the spotlight as it responds to the growing derivatives…
- Price Analysis
Pi Coin Price Prediction as Expert Warns Bitcoin May Hit $70k After BoJ Rate Hike
Pi Coin price rose by 1.05% today, Dec. 18, mirroring the performance of Bitcoin and…
- Price Analysis
Cardano Price Outlook: Will the NIGHT Token Demand Surge Trigger a Rebound?
Cardano price has entered a decisive phase as NIGHT token liquidity rotation intersects with structural…
- Price Analysis
Will Bitcoin Price Crash to $74K as Japan Eyes Rate Hike on December 19?
Bitcoin price continues to weaken after breaking below its recent consolidation range, now trading within…
- Price Analysis
Bitwise Predicts Solana Price Will Hit New All-Time Highs in 2026
Solana price declined by 4% over the past 24 hours, breaking below the key $130…
- Price Analysis
Bitcoin Price Outlook: Capriole Founder Warns of a Drop Below $50K by 2028
Bitcoin price narratives continue to evolve as long-term downside risks regain attention. Bitcoin price discussions…