Solana Price Prediction As Selling Pressure Signals A Pullback
Solana Price Prediction: The Solana coin has seen significant growth since mid-September, surging from $17.41 to its current trading price of $31.99—an 84% increase. However, this bullish momentum is currently experiencing resistance at the $34 level, owing to increased selling pressure in the broader crypto market, particularly as Bitcoin struggles to break past the $35,000 mark. Will this overhead supply lead to a new correction?
Also Read: VanEck Prediction on 10,600% Solana Price Rally By 2030 Triggers Debate
Overhead Supply Hints Upcoming Pullback
- A fake breakout from the $32 resistance sets the SOL price for a minor pullback
- The SOL price may face intense supply pressure $36 mark
- The 24-hour trading volume on the Solana coin is $539 Million, indicating a 43% loss.
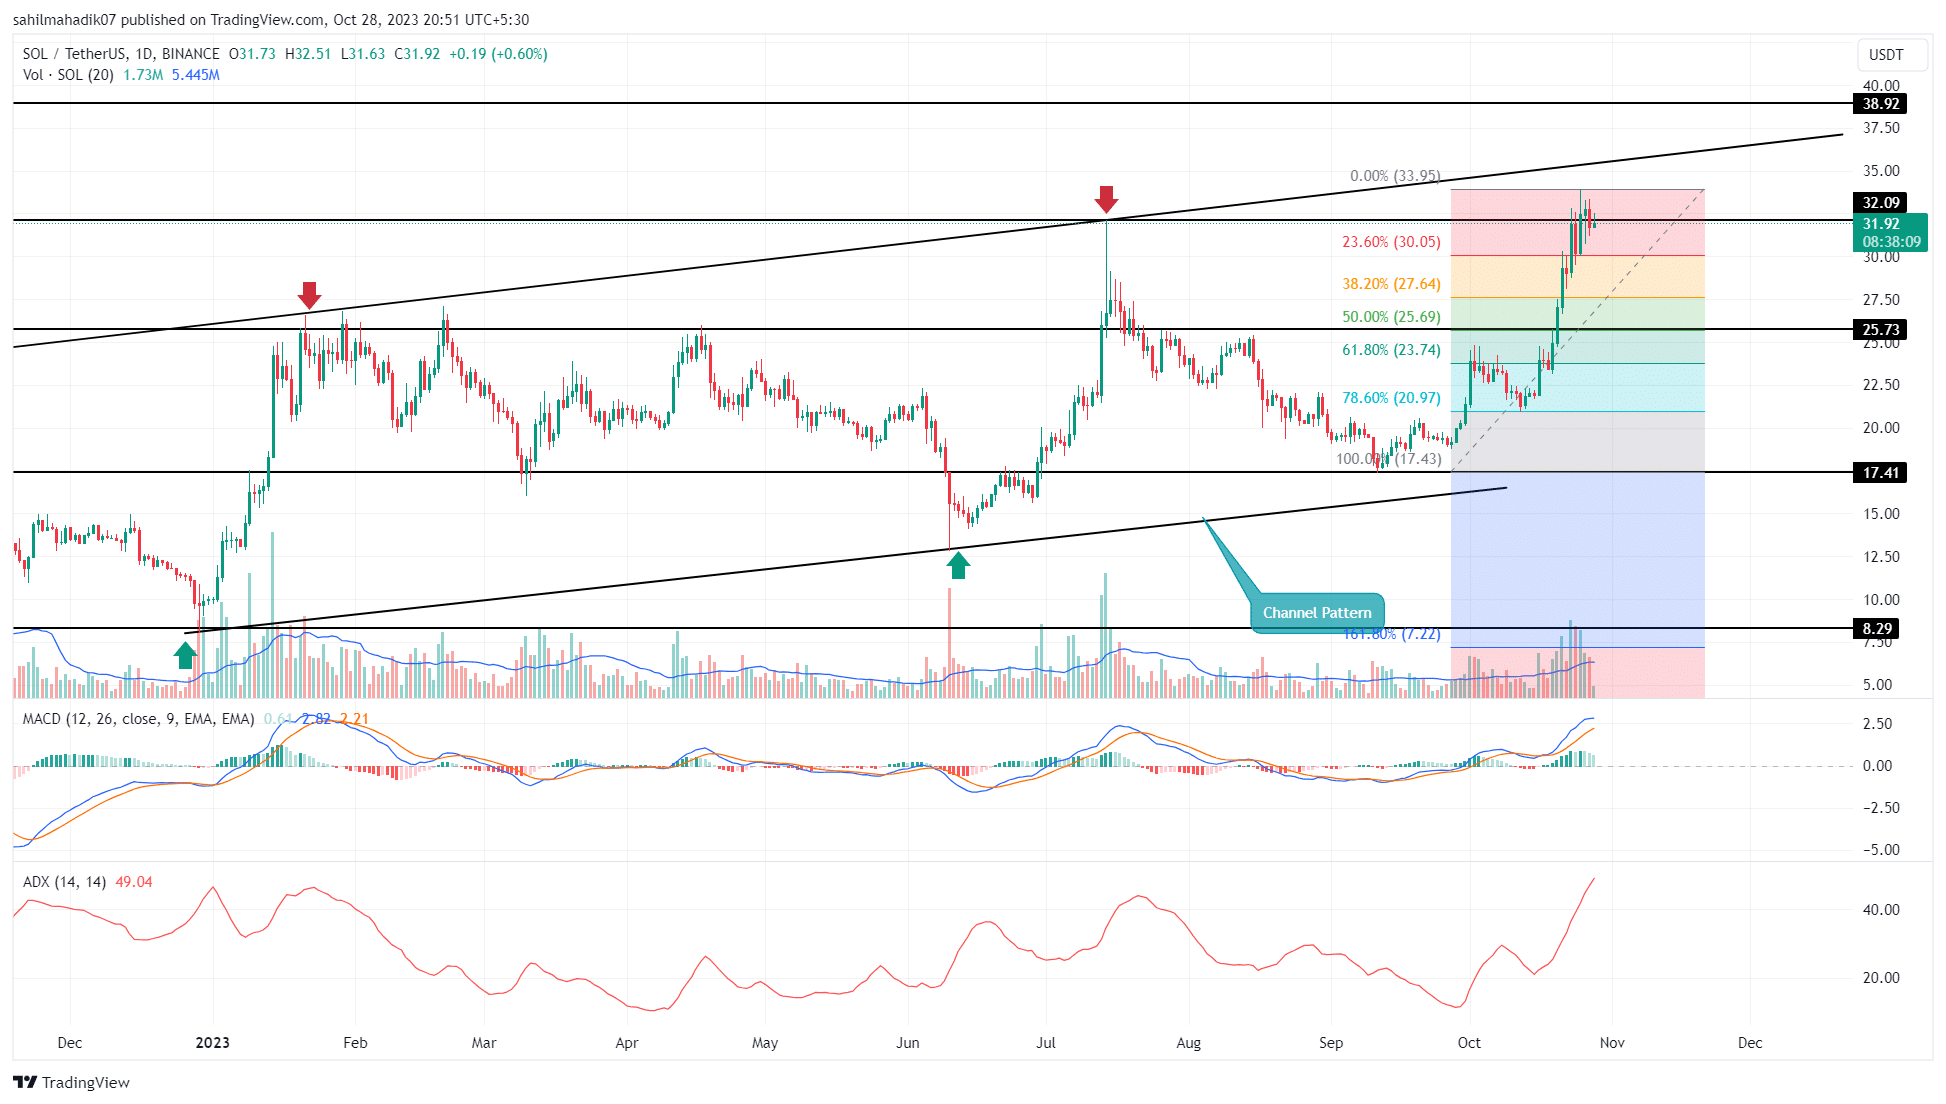
The daily timeframe chart reveals that the Solana price has been trading within a rising channel pattern, maintaining a long-term uptrend. Under the influence of this pattern and prevailing bullish momentum, the coin price could surge 12% to hit the overhead trendline around $36.
While the asset has recently reclaimed the $32 level, the overhead supply seems to be preventing further upside, suggesting that a minor pullback could be on the cards. By the press time, the SOL price trades at $31.83, with a modest growth of 0.3%
Historical data shows that previous pullbacks never went below the 50% Fibonacci retracement level, indicating that any upcoming pullback could potentially find support around the $25.7 mark to rejuvenate bullish momentum.
Can SOL Price Fall Back to $20?
In the near term, the SOL price appears to be on a bullish trajectory. However, investors should watch for significant selling pressure around the $36 resistance level. The asset has historically faced significant selling pressure upon retesting the upper trendline of its channel pattern, currently situated around $36. Previous interactions with this resistance have led to major corrections, and a similar occurrence could send the price tumbling down to the $20 range.
- Moving Average Convergence Divergence: The MACD (blue) slope moving above the signal line reflects a strong bullish trend in this asset.
- Average Directional Index: The ADX slope at 49% reflects the current recovery may reach maturity and thus a pullback is needed to carry a long-term sustained uptrend.
Recent Posts
- Price Analysis
Pi Coin Price Prediction as Expert Warns Bitcoin May Hit $70k After BoJ Rate Hike
Pi Coin price rose by 1.05% today, Dec. 18, mirroring the performance of Bitcoin and…
- Price Analysis
Cardano Price Outlook: Will the NIGHT Token Demand Surge Trigger a Rebound?
Cardano price has entered a decisive phase as NIGHT token liquidity rotation intersects with structural…
- Price Analysis
Will Bitcoin Price Crash to $74K as Japan Eyes Rate Hike on December 19?
Bitcoin price continues to weaken after breaking below its recent consolidation range, now trading within…
- Price Analysis
Bitwise Predicts Solana Price Will Hit New All-Time Highs in 2026
Solana price declined by 4% over the past 24 hours, breaking below the key $130…
- Price Analysis
Bitcoin Price Outlook: Capriole Founder Warns of a Drop Below $50K by 2028
Bitcoin price narratives continue to evolve as long-term downside risks regain attention. Bitcoin price discussions…
- Price Analysis
XRP Price Rare Pattern Points to a Surge to $3 as ETFs Cross $1B Milestone
XRP price dropped by 1.2% today, Dec. 17, continuing a downward trend that started in…