Terra Classic Price Analysis: Is $LUNC Price Ready to Hit $0.00012?
Terra Classic Price Analysis: Over the five days, the LUNC price showed alternate green and red candles indicating no dominance from buyers or sellers to take trend control. This uncertainty could have arisen as the US SEC filed legal action against the big crypto exchanges Binance(BNB) and Coinbase(COIN). Therefore, the Terra classic coin may see prolonged consolidation in the coming days as the overall trend is bearish under the influence of a wedge pattern.
Also Read: Terra Classic’s Biggest v2.1.0 Parity Upgrade Proposal Officially Passed, LUNC To $1
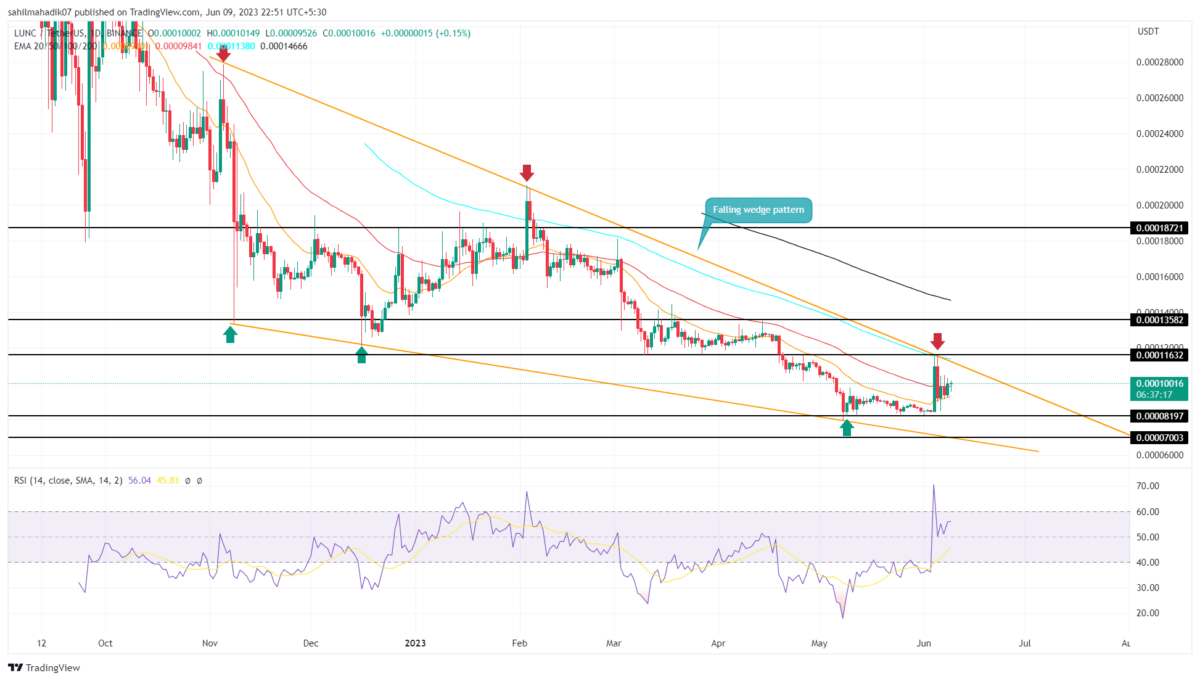
LUNC Price Daily Chart
- Despite the market sentiment remaining volatile, the LUNC price has respected the converging trendline of the wedge pattern
- A bearish reversal from the resistance trendline has set the coin price on a potential 26% drop
- The intraday trading volume in the LUNC coin is $82 Million, indicating a 27% gain.
On June 5th, the LUNC price turned down from the resistance trendline of the wedge pattern. This reversal triggers a bear cycle within the pattern and sets a significant downfall to the lower trendline.
By press time, the coin price trades at the $0.000098 mark and continues to walk sideways, indicating no clear initiation from market participants. However, If the bearish momentum persists, a breakdown below the 20-day EMA could plunge the prices 25-30% to hit the lower trendline located near $0.000065.
Conversely, if the LUNC price rises higher, the buyers may rechallenge the overhead trendline. A breakout above the trendline will be a key signal to kickstart a new recovery rally.
Will LUNC Price Rise to $0.00012?
Under the influence of a falling wedge pattern, the LUNC price stays in a negative trend. The aforementioned reversal has set the coin price for a potential downfall, which may pull the price to the next significant support situated at $0.000082, $0.00007, followed by a lower trendline. Alternatively, the coin price only attains a recovery above the $0.00012 if the buyer breaks the above trendline.
- Exponential Moving Average: The reclaimed 20-and-50-day EMA offers strong support to the coin buyers to rechallenge the overhead trendline.
- Relative Strength Index: Conversely to sideways action, the RSI slope rising indicates the growth in underlying buying pressure.
Recent Posts
- Price Analysis
Pi Coin Price Prediction as Expert Warns Bitcoin May Hit $70k After BoJ Rate Hike
Pi Coin price rose by 1.05% today, Dec. 18, mirroring the performance of Bitcoin and…
- Price Analysis
Cardano Price Outlook: Will the NIGHT Token Demand Surge Trigger a Rebound?
Cardano price has entered a decisive phase as NIGHT token liquidity rotation intersects with structural…
- Price Analysis
Will Bitcoin Price Crash to $74K as Japan Eyes Rate Hike on December 19?
Bitcoin price continues to weaken after breaking below its recent consolidation range, now trading within…
- Price Analysis
Bitwise Predicts Solana Price Will Hit New All-Time Highs in 2026
Solana price declined by 4% over the past 24 hours, breaking below the key $130…
- Price Analysis
Bitcoin Price Outlook: Capriole Founder Warns of a Drop Below $50K by 2028
Bitcoin price narratives continue to evolve as long-term downside risks regain attention. Bitcoin price discussions…
- Price Analysis
XRP Price Rare Pattern Points to a Surge to $3 as ETFs Cross $1B Milestone
XRP price dropped by 1.2% today, Dec. 17, continuing a downward trend that started in…