Terra Classic Price Prediction: What’s Ahead For $LUNC After Reclaiming $0.00006 Mark?

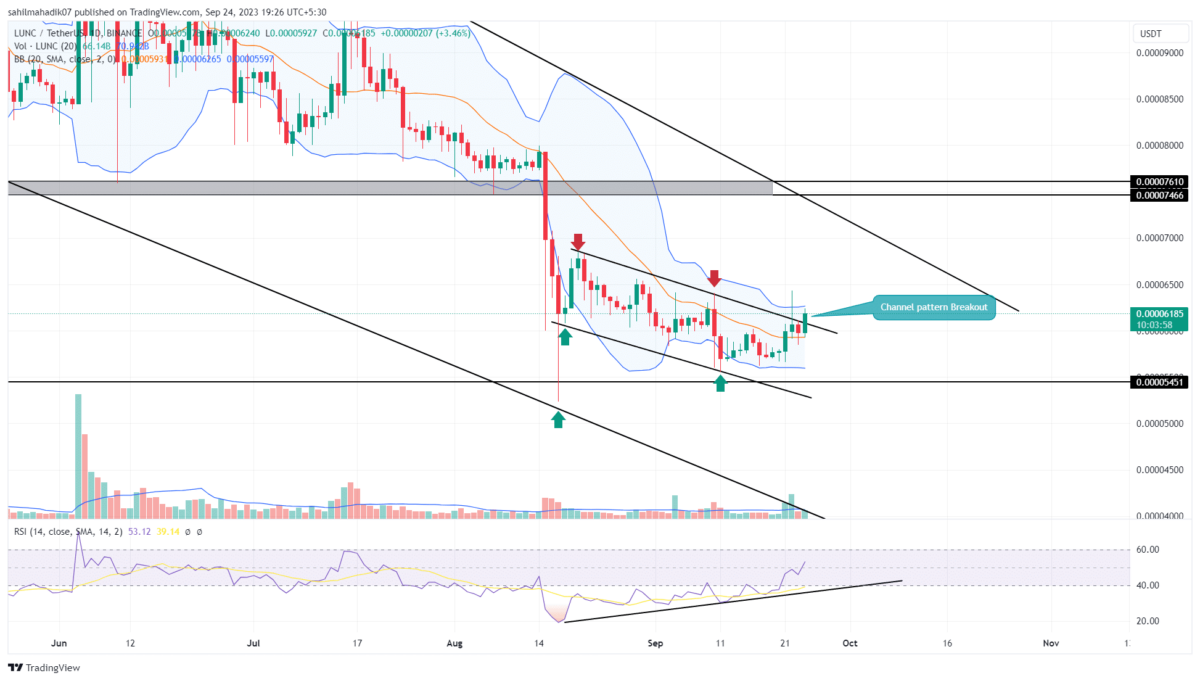
For over a month, the LUNC price correction trend has exhibited a consistent decline in the daily chart. This trajectory is framed by two parallel trend lines, which have acted as dynamic support and resistance. This movement has manifested as a falling channel pattern. Historically, such patterns, especially when nearing a significant low, can signify the potential end of a downtrend, often leading to a notable bullish reversal.
Also Read: Terra Luna Classic (LUNC) Skyrockets 10% Suddenly, Here’s Why
Channel Breakout Sets a 12% Rally
- The coin buyers face an intense supply zone at the overhead trendline
- A bullish breakout from the channel pattern may push the coin price back to the $0.00007 mark.
- The intraday trading volume in the LUNC coin is $20.5 Million, indicating a 8.6% gain.

On September 22nd, the Terra classic coin price broke through the upper boundary of the channel. However, this optimism was short-lived as the coin retreated below the breached line immediately, showcasing the intense selling pressure.
Today, buoyed by a 2.5% intraday gain, the bulls are once again making an attempt to overthrow the prevailing downtrend. Notably, the previous breakout attempt was accompanied by an increase in trading volume, indicating the buyers will need greater strength to overcome this barrier.
Hence, traders should keep a vigilant eye on the daily candle closely to ascertain if a genuine breakout has occurred. If the breakout is confirmed, the former resistance could pivot into crucial support, potentially propelling the coin on a 14% upward journey to reach $0.00007.
However, the aforementioned $0.00007 currently aligns with the upper trendline of a larger channel pattern exerting a higher supply pressure on this altcoin. Thus, a breakout above this pattern is needed to get better confirmation of trend change.
Can LUNC Price Plunge Back to $0.00005?
sellers continue to apply downward pressure, the LUNC price might face another rebuff at the upper trendline. Should this occur, it could fuel a fresh bearish turn within the channel’s confines. A daily close below the recent low of $0.000058 could see the coin descend roughly 10%, targeting the channel’s lower boundary at $0.000052.
- Bollinger Band: The flattish upper band of the Bollinger band indicator can offer additional resistance
- Relative Strength Index: The constant growth in the daily RSI slope reflects the increasing buying pressure at the bottom trendline.
- BlackRock Amends Filing For Staked Ethereum ETF, Eyes 18% of Staking Rewards From ETH Fund
- Arizona Advances Bitcoin, XRP Reserve Bill Using Seized Crypto Assets
- Bitcoin ETF Update: BlackRock Signals BTC Sell-Off as Kevin O’Leary Warns of Decline In Institutional Demand
- Breaking: Tom Lee’s BitMine Buys 45,759 ETH as CryptoQuant Flags Potential Bottom For Ethereum
- Breaking: U.S. CFTC Moves To Defend Polymarket, Kalshi From Regulatory Crackdown By State Regulators
- Pi Network Price Beats Bitcoin, Ethereum, XRP as Upgrades and Potential CEX Listing Fuels Demand
- 5 Things Dogecoin Price Needs to Hit $0.20 in Feb 2026
- Bitcoin Price Prediction as Experts Warns of Quantum Risks
- Dogecoin, Shiba Inu, Pepe Coin Price Predictions As BTC Crashes Below $68k
- Ethereum Price Outlook as Harvard Shifts Focus from Bitcoin to ETH ETF
- HOOD and COIN Stock Price Forecast as Expert Predicts Bitcoin Price Crash to $10k


