Terra Classic Price Dips to $0.000075; Best Time to Buy?
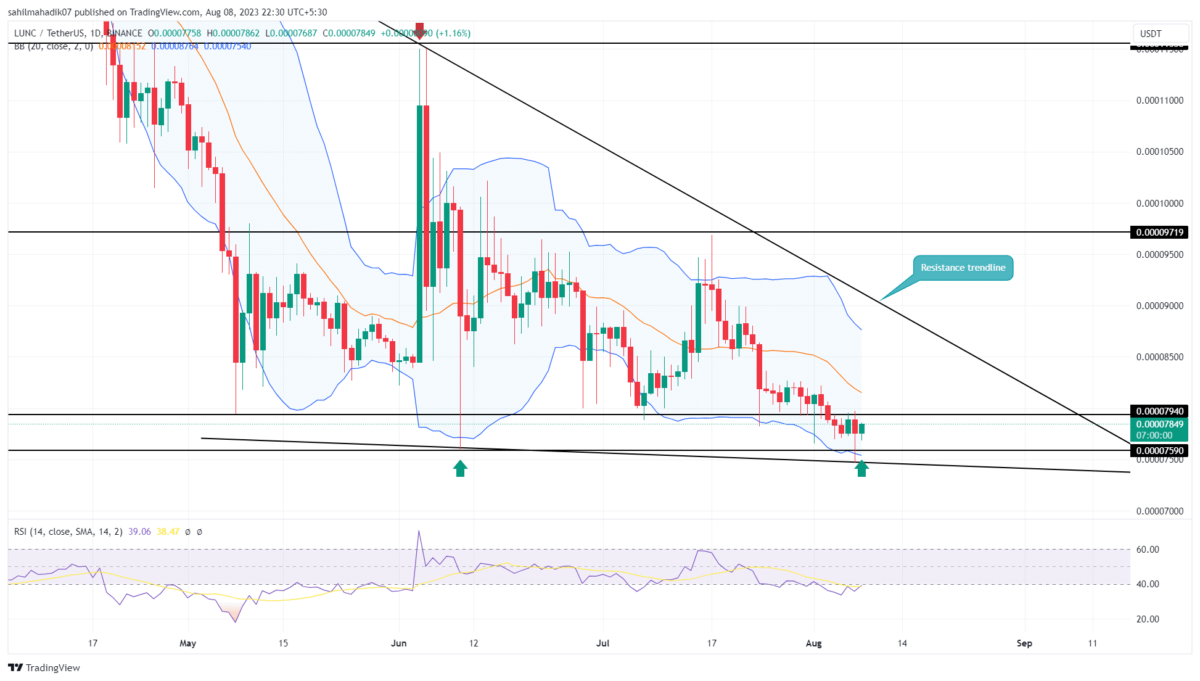
In response to the increasing bearishness in the crypto market, the Terra Classic price is gradually losing ground as it recently marked a yearly low of $0.0000746. On August 7th, the coin price showed a breakdown attempt from the June 10th low of $0.0000759, however, the buyers stepped immediately and reverted the price higher. This high-tail rejection is a sign of a high-demand zone. Can the LUNC price rebound from this support level?
Also Read: Fireblocks Situation Risks Binance And Other Exchanges To Delist Terra Luna Classic (LUNC)
Terra Classic Price Daily Chart
- The LUNC coin may remain in a downward trend until the overhead trendline is intact
- The bullish breakout from the $0.00008 resistance could set the LUNC price for a 10-12% upswing.
- The intraday trading volume in the LUNC coin is $17.8 Million, indicating an 8% loss.
On August 3rd, the Terra classic coin price gave a bearish breakdown from the horizontal support of $0.000075. However, the sellers failed to offer suitable follow-up leading to sideways action below the breached support.
As mentioned above the sellers tried to lower the LUNC coin’s market value on August 7th but the failure to do so indicates the presence of active buying. If the bullish momentum rises, the buyers could trigger a bullish upswing potentially raising the coin price 10-12% higher to hit the overhead trendline.
The market participants interested in this trade can wait for a bullish breakout above the high of the August 3rd candle($0.0000797) for better confirmation of price recovery.
LUNC Price Signals Trend Change?
Over the past five months, the Terra Classic price has been receiving dynamic resistance from a downsloping trendline. The coin price has already turned down thrice from this resistance indicating that traders are actively selling at this barrier. Therefore, the coin holders would need a breakout above this falling trendline to obtain a signal of a trend reversal
- Bollinger Band: The flattish lower band of the Bollinger Band indicator offers additional support to coin buyers.
- Relative Strength Index: Along with the anticipated $0.00008 breakout, the traders must check for the daily RSI slope rises above 40% to gain an extra confirmation of a bullish reversal.
Recent Posts
- Price Analysis
XRP Price Prediction: Will 4 Billion Transactions Spark Next Rally?
XRP price trades below the $2 mark after the latest correction across the broader cryptocurrency…
- Price Analysis
Solana Price Outlook: Will SOL Recover With Strong Institutional Buying?
Solana price remains steady above the $120 support after the recent crypto market pullback. The…
- Price Analysis
Ethereum Price Risks Crash to $2,500 Amid Sustained Wintermute Dumping
Ethereum price dropped below the key support at $3,000 on Tuesday, down by ~40% from…
- Price Analysis
Is It Time to Sell Bitcoin for Gold- Analyst Spots 2023 Pattern That Triggered BTC’s Last Major Rally
The Stock Market rose modestly as crypto market consolidation sparked a fresh Bitcoin vs Gold…
- Price Analysis
Bitcoin Price Prediction and Analysis: Will BTC Hit $100k Before Year-End?
Bitcoin price moves into the final trading sessions with uncertainty around upside continuation. BTC price…
- Price Analysis
Bitcoin Price Prediction As Michael Saylor Pauses BTC Purchase- Is A Fall to $74k Imminent?
Michael Saylor's Strategy has paused additional BTC purchases while increasing cash reserves, prompting renewed speculation…