Terra Price Prediction: LUNA Price Aims 0.23% Fibonacci Retracement On Daily Chart


LUNA price fell sharply in today’s session. Traders seem to collect the liquidity as the price is retraced on the account of profit booking. However, a close below $101 will be a warning sign for the bulls.
- LUNA price tracks lower following the overall fall in the Crypto space.
- A decisive break below 0.23% Fibonacci retracement is poised for more losses.
- The price shed nearly 7% in a single-day session.
LUNA price loses bullish control
On the daily chart, the LUNA price formed fresh record highs near $119.56 in the previous session. But the bulls could not sustain the gains and closed lower. On the same line, today’s session witness intense selling pressure dragging the price near to the lows made on Saturday. The current price action might be because investors are excited to collect the liquidity if holding the token since late January.
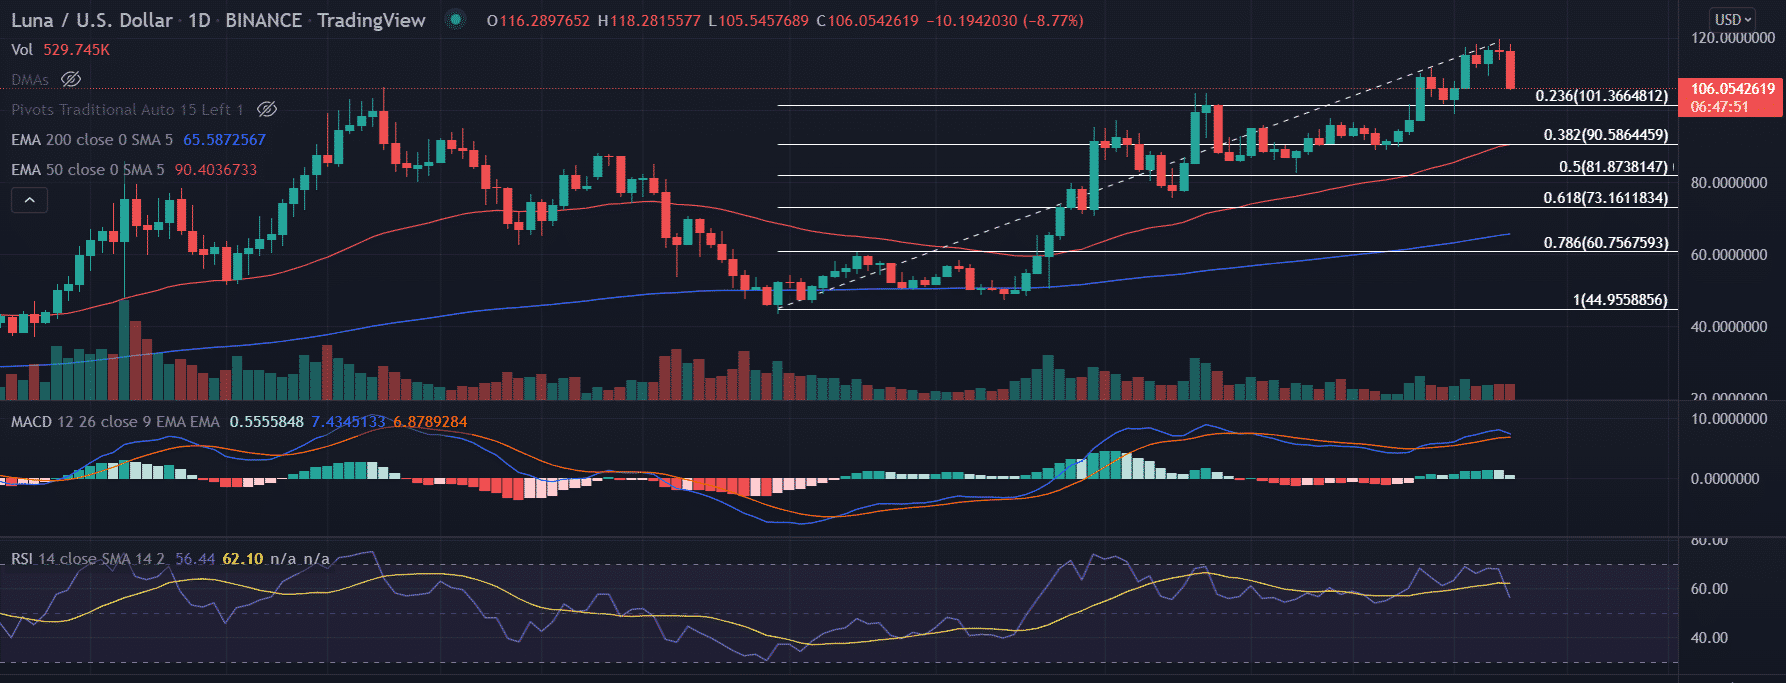
LUNA’s price surged nearly 180% from the lows of $43.0 made on January 31. Currently, the price is retracing toward the $0.23% Fibonacci retracement at $101.36.
Further, if the price breaks below the vital support level the sellers could revisit the horizontal support level at $90.0 which coincides with the $0.382% Fibonacci retracement level.
On the flip side, a shift in the bearish sentiment would invalidate the bearish outlook in the pair. In this case, the price would immediately be traced back to the previous session’s highs of $119.56.
In addition to that, investors will keep their approach to gain an extra edge to reach out a fresh yearly record at $120.0
As of writing, LUNA/USD is trading at $106.33, down 8.56% for the day. The seventh-largest cryptocurrency by market cap is keeping the 24-hour trading volume at $3,142,042,793 as per the CoinMarketCap.
Technical Indicators:
RSI: The daily Relative Strength Index fell below the average line and continued to move lower. It reads at 56.
MACD: The Moving Average Convergence Divergence trades with a neutral bias while it still holds above the midline.

Why Trust CoinGape
CoinGape has covered the cryptocurrency industry since 2017, aiming to provide informative insights Read more…to our readers. Our journal analysts bring years of experience in market analysis and blockchain technology to ensure factual accuracy and balanced reporting. By following our Editorial Policy, our writers verify every source, fact-check each story, rely on reputable sources, and attribute quotes and media correctly. We also follow a rigorous Review Methodology when evaluating exchanges and tools. From emerging blockchain projects and coin launches to industry events and technical developments, we cover all facets of the digital asset space with unwavering commitment to timely, relevant information.

Related Articles


- Brazil Targets 1M BTC Strategic Reserve to Rival U.S. Bitcoin Stockpile
- Breaking: U.S. CPI Inflation Falls To 4-Year Low Of 2.4%, Bitcoin Rises
- Bitget Launches Gracy AI For Market Insights Amid Crypto Platforms Push For AI Integration
- BlackRock Signals $257M Bitcoin and Ethereum Sell-Off Ahead of Partial U.S. Government Shutdown
- XRP News: Jane Street Emerges Among Key Institutions Driving XRP ETF Inflows
- Bitcoin Price Outlook As Gold And Silver Lose $3.6 Trillion in Market Value
- XRP and Ethereum Price Prediction as Trump Seeks to Lower Key Tariffs
- Solana Price Prediction as $2.6 Trillion Citi Expands Tokenized Products to SOL
- Bitcoin Price Could Fall to $50,000, Standard Chartered Says — Is a Crash Coming?
- Cardano Price Prediction Ahead of Midnight Mainnet Launch
- Pi Network Price Prediction as Mainnet Upgrade Deadline Nears on Feb 15


