 Buy $GGs
The Triangle Pattern Will Extend Sideways Rally In Cardano


The Cardano(ADA) price resonated within a symmetrical triangle pattern over The past four months. The coin price wavering inside this pattern without any direction indicates a no-trading zone. Thus, the interest traders must wait for the breakout before positioning their funds in Cardano.
Key points from Cardano analysis:
- Channel pattern breakdown indicates the continuation of the ongoing range-bound rally
- The coin buyers lose the dynamics support of the 20-day EMA
- The intraday trading volume in the ADA coin is $103.6 Billion, indicating a 104.6% gain.
 Source- Tradingview
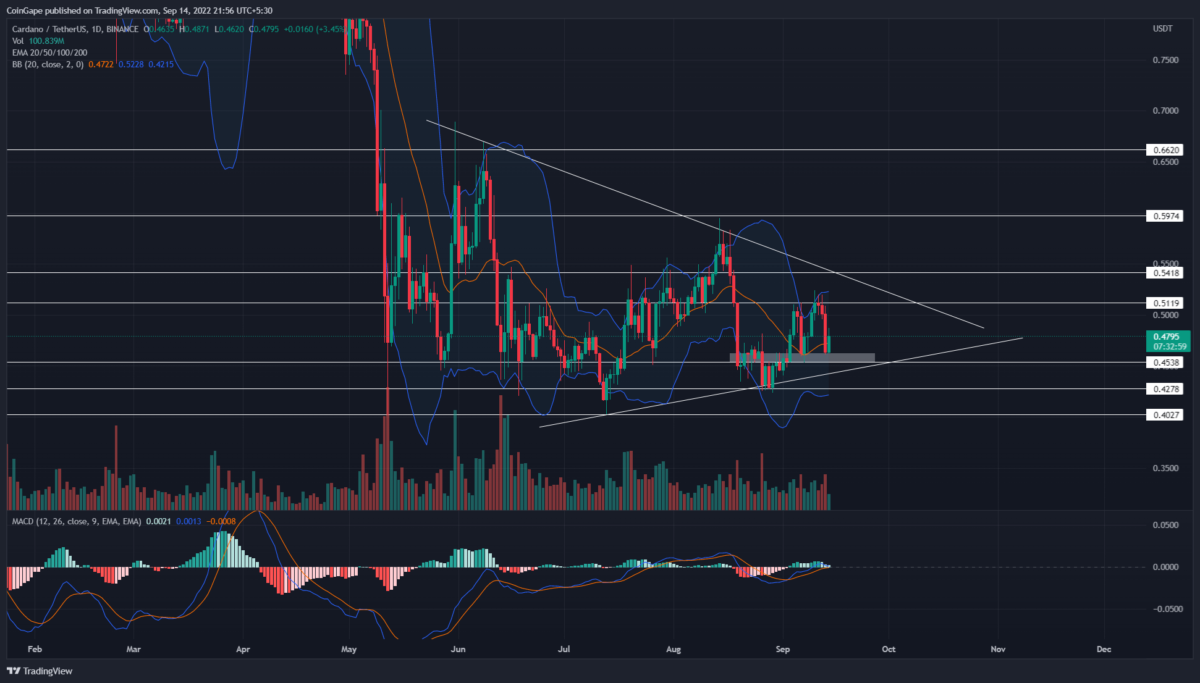
The ADA/USD daily time frame chart shows the formation of a symmetrical triangle pattern. Under the influence of this pattern, the altcoin is walking a lateral path and gradually narrowing its price spread.
The last bull cycle from the support trendline surged prices to the $0.512 resistance. However, the Cardano price has failed twice to surpass this barrier within a fortnight, indicating a high supply zone. Moreover, the recent sell-off in the crypto market bolstered the price reversal from the $0.512 mark and tumbled the market value by 9.6% to hit $0.46-$0.454.
Today the Cardano price is 4% up and aims to resume the bull cycle higher. However, the bullish candle backed by low volume indicates weakness in underlying bullishness. Thus, the price will likely revert from $0.512 or the resistance trendline.
Thus, the moral of the story is that until the Cardano price is inside the triangle pattern, it will continue to follow a directionless rally and continue wobble from one level to another.
Therefore, the right time to trade this continuation pattern is when the price gives a decisive breakout from either trendline. Doing so will initiate a direction rally on the breakout side.
Technical Indicator
Bollinger band indicator: the Cardano coin moving above the indicator midline inside the current market price is higher than the average value as per the ongoing price range. Moreover, these mean lines may offer additional support to extend the price recovery.
MACD indicator: the fast and slow lines wavering at the equilibrium zone indicates a neutral bias.
- Resistance levels- $0.512, and $0.542
- Support levels- $0.453 and $0.428
Play 10,000+ Casino Games at BC Game with Ease
- Instant Deposits And Withdrawals
- Crypto Casino And Sports Betting
- Exclusive Bonuses And Rewards


Why Trust CoinGape
CoinGape has covered the cryptocurrency industry since 2017, aiming to provide informative insights Read more…to our readers. Our journal analysts bring years of experience in market analysis and blockchain technology to ensure factual accuracy and balanced reporting. By following our Editorial Policy, our writers verify every source, fact-check each story, rely on reputable sources, and attribute quotes and media correctly. We also follow a rigorous Review Methodology when evaluating exchanges and tools. From emerging blockchain projects and coin launches to industry events and technical developments, we cover all facets of the digital asset space with unwavering commitment to timely, relevant information.

Related Articles


- Peter Schiff Predicts BTC to Fall, Gold to Rise as Markets Price in Prolonged Iran War
- Institutional Re-Accumulation Signs Emerge as Bitcoin ETFs See $1.1B Net Inflows Since Iran War Began: Glassnode
- From Mining Pool to Infrastructure Platform: Nine Years of EMCD
- U.S.-Iran War: U.S. Oil Prices Spike To One-Year High, Bitcoin and Gold Dip
- Crypto Traders Bet Against U.S.-Iran Ceasefire This Month as Iran Denies Peace Talks
- HOOD Stock Targets $100 as Robinhood Unveils Platinum Card and Advance Dividend Feature
- Bitcoin Price Prediction if Donald Trump Signs the CLARITY Act on April 3, 2026
- Pi Network Price As BTC Rallies Above $74K: Can PI Coin Extend Gains to $0.30?
- XRP Price As Bitcoin Reclaims $74K- Is $5 Next?
- Dogecoin Price Outlook as BTC Recovers Above $73,000
- XRP Price Prediction as Iran-U.S. Peace Talks Trigger a Crypto Rally


