This Coin Skyrocketed By 200% Over Last Week; Shall You Buy?
UMA, the native token of the Universal Market Access Protocol, has garnered significant attention from cryptocurrency investors, particularly due to its impressive performance in a market fraught with uncertainty. Over the past four days, the UMA price has skyrocketed by 212%, achieving a remarkable 20-month peak at $6.73. This surge represents a decisive breakout from a prolonged period of accumulation, marking the emergence of a bullish reversal trend that could pave the way for sustained future growth.
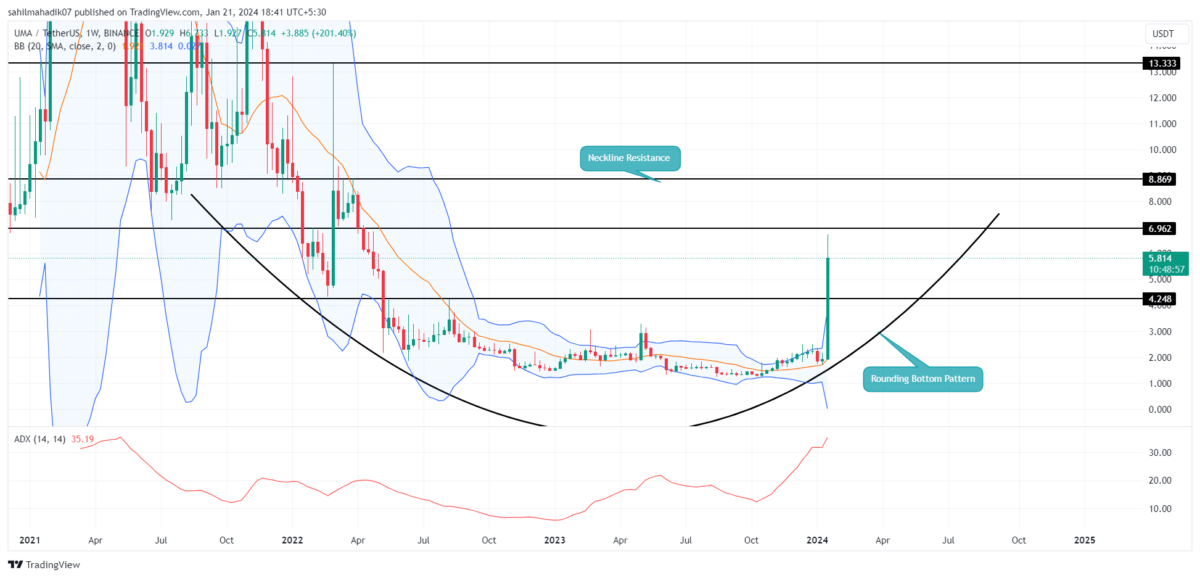
UMA Price Escape From Accumulation Trend Hints New Rally Ahead
- A rounding bottom pattern governs the current recovery trend in UMA price.
- A rising price may face overhead supply at $6.92, followed by $8.87 and $13.3
- The intraday trading volume in UMA is $553.7 Million, indicating a 33% loss.
For the past 20 months, the UMA Price had been largely trading in a lateral movement, struggling to maintain its value above the key resistance level of $4.25. However, this scenario changed dramatically earlier this week when altcoin experienced a substantial influx of investment. This surge led to a remarkable escalation in its price, soaring from $1.92 to $5.98 – a staggering 210% growth within a week.
This rally could be attributed to the upcoming launch of ‘Oval’- a crypto solution that, UMA is launching around next week that will elegantly reclaim >$100m of free money lost each year to MEV(Maximal extractable value)- stated by UMA Co-founder Hart Lambur in an X Post.
Coinciding with these developments, the Total Value Secured (TVS) in UMA also experienced a significant boost, reaching a new All-Time High of $775 million.
On January 19th, the UMA price gave a decisive breakout from the $4.25 resistance, which indicates the buyers escaped from a 20-month-long accumulation. Followed by a retest candle, the coin price is 25% up today projecting its suitability for high growth.
Bullish Reversal Pattern Hints Bottom Formation
A look at the daily time frame chart shows the current recovery in UMA price is developing into a rounding bottom pattern. The chart set often indicates the bottom formation of an asset and promotes gradual accumulation from traders to lead to a new recovery. If this buying momentum continues, the UMA price may present a new entry opportunity with a potential breakout above the $6.92 resistance level.
Under the influence of this pattern, the UMA price is likely to chase $13.37 neckline resistance, accounting for 128% potential growth.
- Bollinger Band: A coin price challenging the upper boundary of the Bollinger Band indicator accentuates the buyers’ aggressiveness.
- Average Direction Index: The high value of ADX(35) reflects the ongoing rally may soon hit exhaustion and trigger a minor pullback to sustain its growth.
Related Articles:
- Bitcoin’s Maintains Lukewarm Performance Amid S&P 500 Record High
- Crypto Headlines of the Week: Bitcoin ETFs Advance, Binance & Terra Propel Speculations
- Crypto Price Prediction For Jan 21: Ethereum (ETH), Solana (SOL), Luna Classic (LUNC)
Recent Posts
- Price Analysis
Will Solana Price Hit $150 as Mangocueticals Partners With Cube Group on $100M SOL Treasury?
Solana price remains a focal point as it responds to both institutional alignment and shifting…
- Price Analysis
SUI Price Forecast After Bitwise Filed for SUI ETF With U.S. SEC – Is $3 Next?
SUI price remains positioned at a critical intersection of regulatory positioning and technical structure. Recent…
- Price Analysis
Bitcoin Price Alarming Pattern Points to a Dip to $80k as $2.7b Options Expires Today
Bitcoin price rebounded by 3% today, Dec. 19, reaching a high of $87,960. This rise…
- Price Analysis
Dogecoin Price Prediction Points to $0.20 Rebound as Coinbase Launches Regulated DOGE Futures
Dogecoin price has gone back to the spotlight as it responds to the growing derivatives…
- Price Analysis
Pi Coin Price Prediction as Expert Warns Bitcoin May Hit $70k After BoJ Rate Hike
Pi Coin price rose by 1.05% today, Dec. 18, mirroring the performance of Bitcoin and…
- Price Analysis
Cardano Price Outlook: Will the NIGHT Token Demand Surge Trigger a Rebound?
Cardano price has entered a decisive phase as NIGHT token liquidity rotation intersects with structural…