This Week Ethereum Price Seeks 18% Gains; Here’s why


Ethereum price analysis is negatively biased for today. However, the price rallied more than 8% this week. ETH bulls took a breather at the $1,650 level. The buyers are taking calculated steps to lift from the critical support level of around $1,420.
A pullback above the $1,600 level would invalidate the bearish sentiment as the price shows consolidation near a higher level.
- Ethereum price edges lower for the second straight day.
- A weekly close above $1,600 would bring in more gains.
- However, the downside risk remains intact below $1,500.
Ethereum price consolidates with a diminishing downside momentum
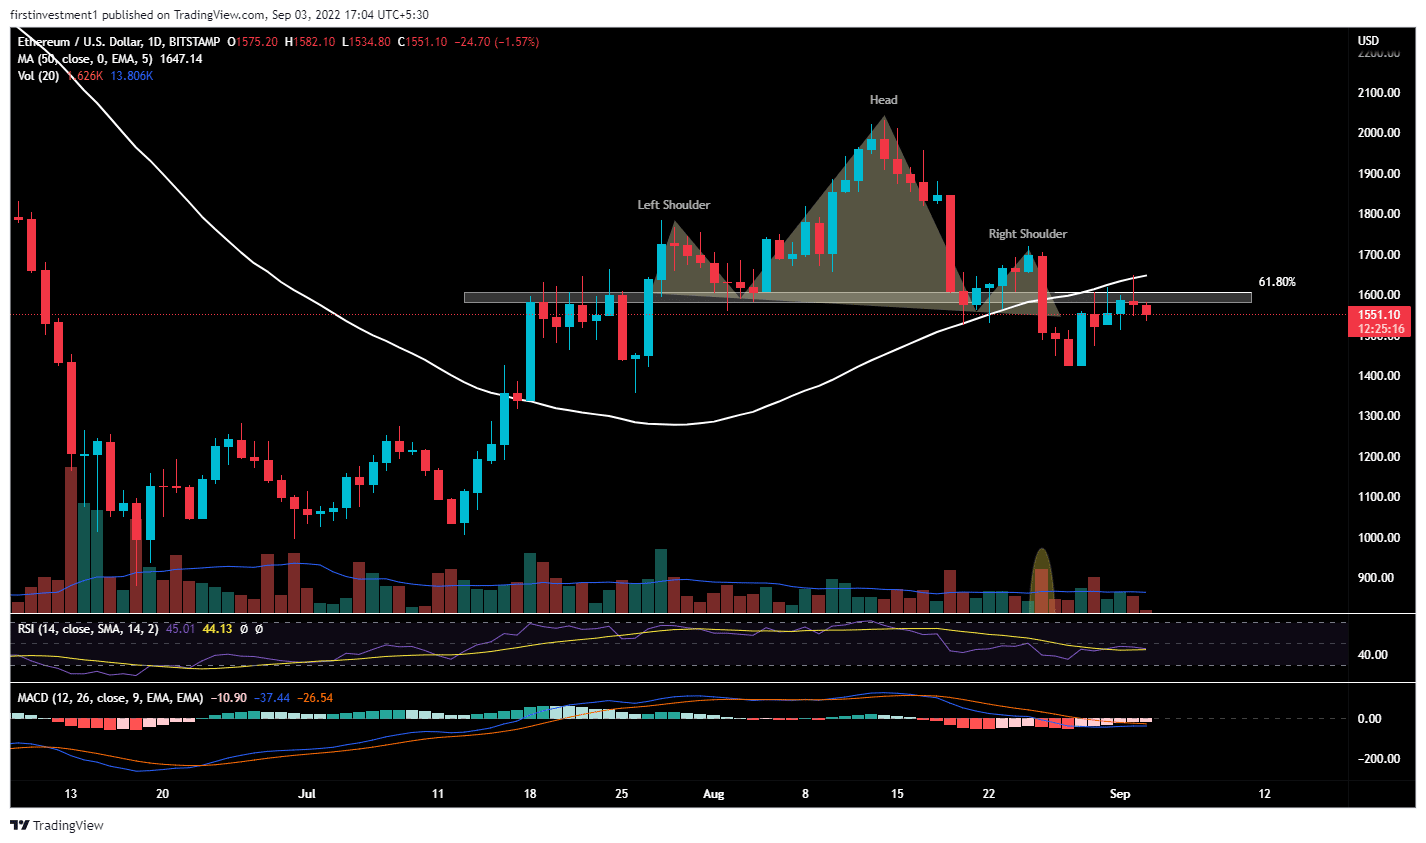
On the daily chart, ETH gave a breakdown of a bearish “Head & Shoulder” pattern, breaking down the neckline support, with rising volumes compared to previous average volumes.
The neckline support lies between $1,578 to $1,610. ETH faces heavy resistance at the pattern’s neckline. The asset takes rejection on a pullback, and faces rejection at 61.8% Fibonacci retracement, along with the 50-day exponential moving average.
If the price sustains below $1,515, then there is a higher chance of ETH even dropping toward $1,425.
On the other hand, a renewed buying pressure could result in a green candlestick. If that happens it would mean a mean reversion from the consolidation to the higher level.
ETH buyers could enjoy a quick rally toward the $1,600 mark. Further, a move above $1,722 would motivate bulls to recapture the high of August 19 at $1,848.92.
The RSI is trading below 50. When the relative strength index is below 50, it generally means that the losses are greater than the gains. Whereas, the MACD line crosses below the signal line below zero, indicating a bearish trend.
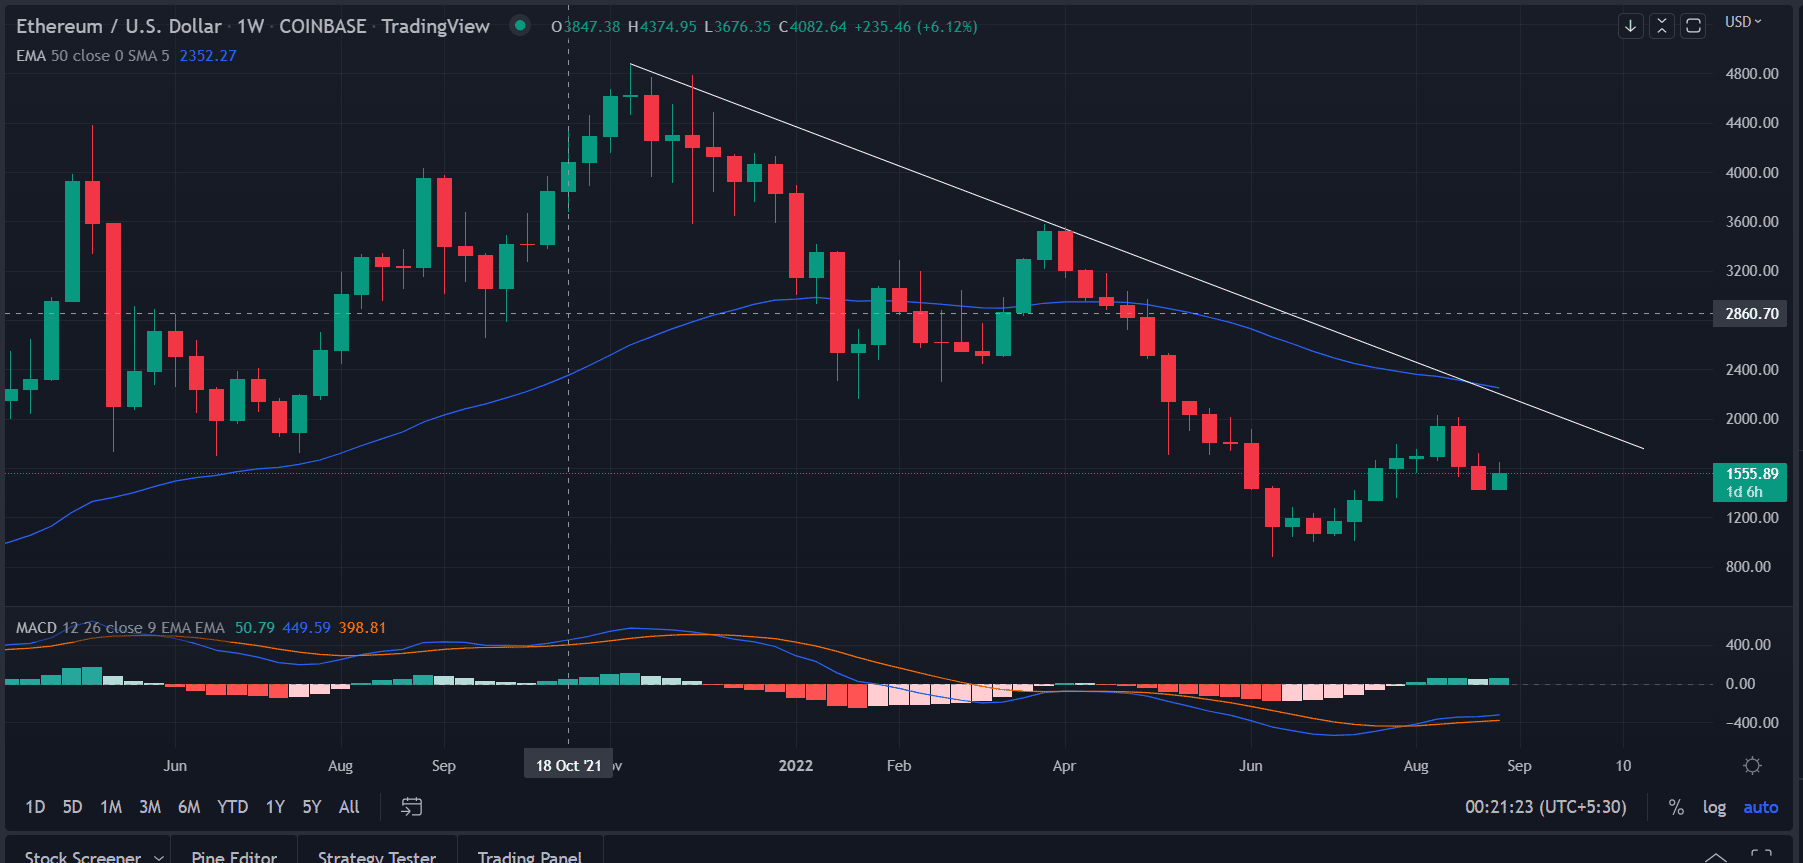
The Ethereum price analysis on the weekly chart booked gains for the first time in the previous two weeks.
The sellers remained active at the higher level pushing the price lower. The descending trend line from the highs of $4,867.81. The price rejected the bearish slopping line in April and the selling get acceleration toward the all-time low at $879.80 in June.
Also read: https://BlackRock Set To Index Bitcoin (BTC) Prices
The formation of two consecutive inverted hammer points at a probable reversal is around the corner. We expect the price to jump toward the downside line at $1,900.
In contrast, a weekly close below $1,420 could mark the onset of another downward rally toward $1,200.
As of publication time, ETH/USD is reading at $1,554, down 1.33% for the day. The 24-hour trading volume dropped more than 37% to $107 billion. The decline in volume with the lower price is a signal of a weakening downtrend.

Why Trust CoinGape
CoinGape has covered the cryptocurrency industry since 2017, aiming to provide informative insights Read more…to our readers. Our journal analysts bring years of experience in market analysis and blockchain technology to ensure factual accuracy and balanced reporting. By following our Editorial Policy, our writers verify every source, fact-check each story, rely on reputable sources, and attribute quotes and media correctly. We also follow a rigorous Review Methodology when evaluating exchanges and tools. From emerging blockchain projects and coin launches to industry events and technical developments, we cover all facets of the digital asset space with unwavering commitment to timely, relevant information.
Related Articles


- Bringing Compute Power to the Masses in a Sustainable, Decentralized Manner
- Bitcoin Reserve: U.S. Treasury Rules Out BTC Buys as GOP Senators Push For Use Of Gold Reserves
- Epstein Files: How Jeffrey Epstein Had Ties to Bitcoin and Crypto’s Early Development
- Crypto Market Continues to Plunge, Could 2026 Be the Worst Year?
- Ripple Prime Adds Support for Hyperliquid, Providing Wall Street Access to DeFi
- Solana Price Crashes Below $95 for the First Time Since 2024: How Low Will SOL Go Next?
- Ethereum Price Eyes a Rebound to $3,000 as Vitalik Buterin Issues a Warning on Layer-2s
- Pi Network Price Outlook as Bitcoin Faces a Strong Sell-Off Below $80k
- Bitcoin Price Prediction As US House Passes Government Funding Bill to End Shutdown
- Ondo Price Prediction as MetaMask Integrates 200+ Tokenized U.S. Stocks
- XRP Price Risks Slide to $1 Amid Slumping XRPL Metrics and Burn Rate


