Uniswap Token Price Falling in Response to Channel Pattern; Back to $4.6?
Under the influence of a falling channel pattern, the Uniswap token price showed a steady downfall in the past five weeks. However, the very nature of this pattern is to resume a strong bull rally once the price breaks the overhead trendline. Thus, interested buyers must wait for pattern breakout to get the right entry opportunity.
Key points Uniswap token price analysis:
- The UNI price will continue its downward spiral until the falling channel pattern is intact
- A bullish RSI divergence suggests the UNI prices may soon witness a significant recovery
- The 24-hour trading volume in the Uniswap token is $120 Million, indicating a 88% gain.
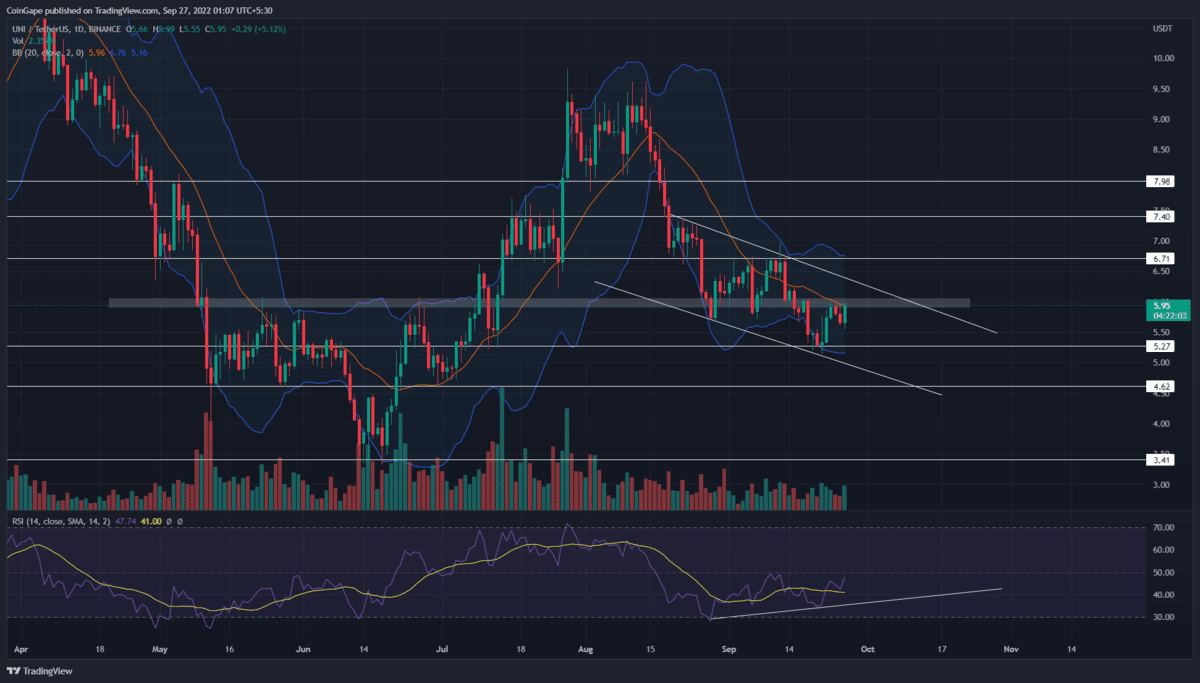
The recent correction in the crypto market plunged the Uniswap token to local support of $5.27. The downfall has offset nearly 70% of gains obtained during the previous recovery rally. The coin price rebounded from the $5.27 support and initiated a minor pullback.
The price reversal soared the Uniswap token price by 14.3% and retested the $6 level as potential resistance. Last three days, the coin chart showed a higher price rejection candle at the $6 resistance, indicating the sellers are aggressively deafening this level.
Moreover, the daily time frame chart showed the formation of a falling parallel channel pattern. The resistance trendline of this pattern wavering at the $6 mark offers an additional hurdle against the bullish growth.
This confluence resistance could exert significant selling pressure on traders to revert the prices lower. As a result, the potential reversal will indicate the resumption of prevailing correction and tumble of the Uniswap token price by 10.84% to break the $5.27.
On a contrary note, the technical setup indicates the coin price should eventually breach the resistance trendline to trigger a new recovery rally.
Technical indicator
RSI indicator: the daily-RSI slope shows an evident bullish divergence concerning the last two lower lows in price action. This divergence indicates growth in bullish momentum and a better possibility for the bullish breakout from the channel pattern.
Bollinger band indicator: the coin price retest to the indicator’s midline will encourage downfall continuation.
- Resistance levels- $6, $6.7
- Support levels- $5.27 and $4.65
Recent Posts
- Price Analysis
Pi Coin Price Prediction as Expert Warns Bitcoin May Hit $70k After BoJ Rate Hike
Pi Coin price rose by 1.05% today, Dec. 18, mirroring the performance of Bitcoin and…
- Price Analysis
Cardano Price Outlook: Will the NIGHT Token Demand Surge Trigger a Rebound?
Cardano price has entered a decisive phase as NIGHT token liquidity rotation intersects with structural…
- Price Analysis
Will Bitcoin Price Crash to $74K as Japan Eyes Rate Hike on December 19?
Bitcoin price continues to weaken after breaking below its recent consolidation range, now trading within…
- Price Analysis
Bitwise Predicts Solana Price Will Hit New All-Time Highs in 2026
Solana price declined by 4% over the past 24 hours, breaking below the key $130…
- Price Analysis
Bitcoin Price Outlook: Capriole Founder Warns of a Drop Below $50K by 2028
Bitcoin price narratives continue to evolve as long-term downside risks regain attention. Bitcoin price discussions…
- Price Analysis
XRP Price Rare Pattern Points to a Surge to $3 as ETFs Cross $1B Milestone
XRP price dropped by 1.2% today, Dec. 17, continuing a downward trend that started in…